OPEN-SOURCE SCRIPT
CUSUM Peaks & Troughs with Drift
This script implements an Improved CUSUM (Cumulative Sum) Peaks & Troughs with Drift indicator. Here's a breakdown of how it works:
Input Parameters:
cusumThreshold: Threshold value for detecting peaks and troughs.
cusumDrift: Drift value used to adjust the CUSUM calculation.
movingAverageLength: Length of the moving average used as a reference for deviation calculation.
Moving Average Calculation:
Calculates the simple moving average (SMA) of the closing prices over a specified length.
Price Deviation Calculation:
Computes the deviation of the closing price from the moving average.
CUSUM Calculation with Drift:
Utilises cumulative sum (CUSUM) calculations with drift adjustment.
Tracks positive and negative deviations from the moving average, considering the specified drift value.
Peak and Trough Detection:
Detects peaks and troughs based on the predefined thresholds (cusumThreshold).
Resets the CUSUM values when peaks or troughs are detected.
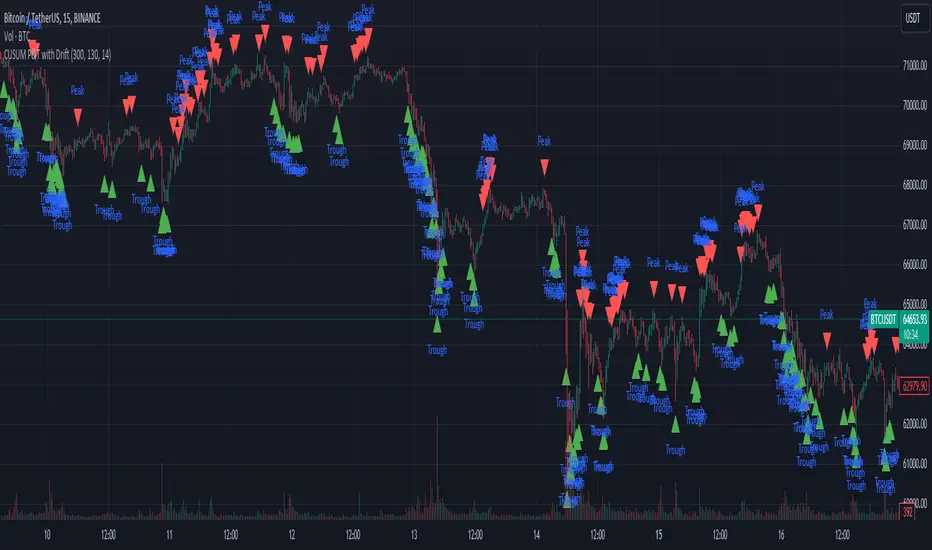
Plotting:
Plots shapes (triangles) above the bars for peaks and below the bars for troughs.
Optionally, you can uncomment the lines to visualise the CUSUM values and the zero line for reference.
This indicator helps identify potential turning points or reversals in the price action by detecting peaks (high points) and troughs (low points) in the cumulative sum of price deviations from the moving average, considering drift to adapt to underlying trends in the data.
Input Parameters:
cusumThreshold: Threshold value for detecting peaks and troughs.
cusumDrift: Drift value used to adjust the CUSUM calculation.
movingAverageLength: Length of the moving average used as a reference for deviation calculation.
Moving Average Calculation:
Calculates the simple moving average (SMA) of the closing prices over a specified length.
Price Deviation Calculation:
Computes the deviation of the closing price from the moving average.
CUSUM Calculation with Drift:
Utilises cumulative sum (CUSUM) calculations with drift adjustment.
Tracks positive and negative deviations from the moving average, considering the specified drift value.
Peak and Trough Detection:
Detects peaks and troughs based on the predefined thresholds (cusumThreshold).
Resets the CUSUM values when peaks or troughs are detected.
Plotting:
Plots shapes (triangles) above the bars for peaks and below the bars for troughs.
Optionally, you can uncomment the lines to visualise the CUSUM values and the zero line for reference.
This indicator helps identify potential turning points or reversals in the price action by detecting peaks (high points) and troughs (low points) in the cumulative sum of price deviations from the moving average, considering drift to adapt to underlying trends in the data.
오픈 소스 스크립트
트레이딩뷰의 진정한 정신에 따라, 이 스크립트의 작성자는 이를 오픈소스로 공개하여 트레이더들이 기능을 검토하고 검증할 수 있도록 했습니다. 작성자에게 찬사를 보냅니다! 이 코드는 무료로 사용할 수 있지만, 코드를 재게시하는 경우 하우스 룰이 적용된다는 점을 기억하세요.
면책사항
해당 정보와 게시물은 금융, 투자, 트레이딩 또는 기타 유형의 조언이나 권장 사항으로 간주되지 않으며, 트레이딩뷰에서 제공하거나 보증하는 것이 아닙니다. 자세한 내용은 이용 약관을 참조하세요.
오픈 소스 스크립트
트레이딩뷰의 진정한 정신에 따라, 이 스크립트의 작성자는 이를 오픈소스로 공개하여 트레이더들이 기능을 검토하고 검증할 수 있도록 했습니다. 작성자에게 찬사를 보냅니다! 이 코드는 무료로 사용할 수 있지만, 코드를 재게시하는 경우 하우스 룰이 적용된다는 점을 기억하세요.
면책사항
해당 정보와 게시물은 금융, 투자, 트레이딩 또는 기타 유형의 조언이나 권장 사항으로 간주되지 않으며, 트레이딩뷰에서 제공하거나 보증하는 것이 아닙니다. 자세한 내용은 이용 약관을 참조하세요.