OPEN-SOURCE SCRIPT
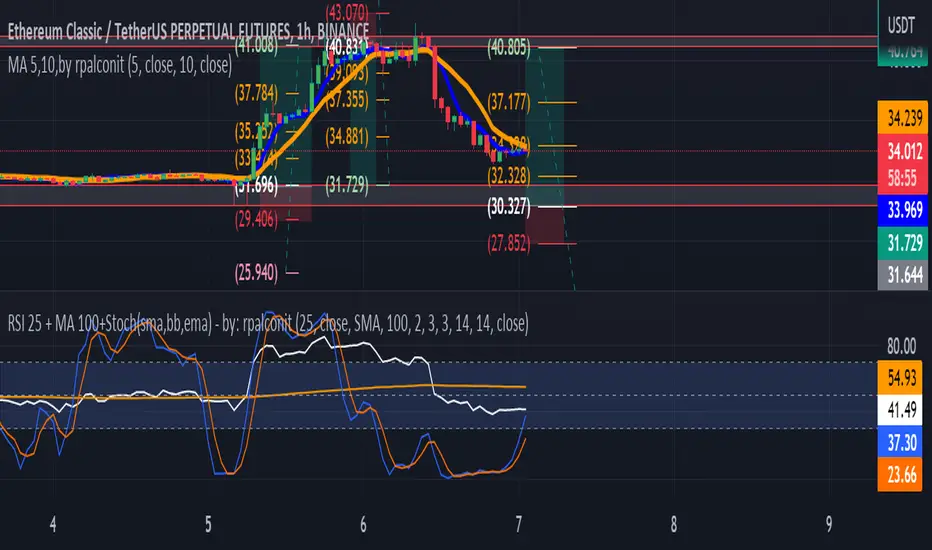
RSI 25 + MA 100+Stoch(sma,bb,ema) - by: rpalconit
Hello everyone,
This indicator uses RSI 25 + MA 100 + Stoch(sma,bb,ema to show buy and sell signals.
Signal Features:
• Buy Signal: It gives a buy signal when the RSI Length 25 bend upward below middle/lower bands and crosses MA 100 .
• Sell Signal: It gives a buy signal when the RSI Length 25 bend downward above middle/upper bands and crosses MA 100 .
• .
• Strong Buy Signal: It gives a strong buy signal when the RSI Length 25 bend upward below lower band and within overbought area of 30
• Storng Sell Signal: It gives a strong sell signal when the RSI Length 25 bend downward below lower band and within oversold area of 70.
You can change RSI length in any of your preference. And the Moving average you can select them from the list such as Simple Moving Average(SMA), Bollinger Bands( BB)and Exponential Moving Average (EMA.
In addition it includes momentum indicator like Stochastic RSI for more confirmation.
Details about the indicator
INPUTS
Time Frame
• Time Frames Chart: You can select your preferred timeframe at the dropdown list.
Relative Strength Index Settings
RSI Length: You can choose your preferred RSI length at the dropdown list.
RSI Source: You can choose your preferred RSI source at the dropdown list.
MA Setting:
1. MA Type: You can choose your preferred MA Type at the dropdown list.
2. MA Length: You can choose your preferred MA Length at the dropdown list.
3. stdDiv: You can choose your preferred the dropdown list.
Stochastic RSI gives you an idea about momentum if reach to the oversold and overbought areas.
Best regards,
ruelpalconit
오픈 소스 스크립트
트레이딩뷰의 진정한 정신에 따라, 이 스크립트의 작성자는 이를 오픈소스로 공개하여 트레이더들이 기능을 검토하고 검증할 수 있도록 했습니다. 작성자에게 찬사를 보냅니다! 이 코드는 무료로 사용할 수 있지만, 코드를 재게시하는 경우 하우스 룰이 적용된다는 점을 기억하세요.
면책사항
해당 정보와 게시물은 금융, 투자, 트레이딩 또는 기타 유형의 조언이나 권장 사항으로 간주되지 않으며, 트레이딩뷰에서 제공하거나 보증하는 것이 아닙니다. 자세한 내용은 이용 약관을 참조하세요.
오픈 소스 스크립트
트레이딩뷰의 진정한 정신에 따라, 이 스크립트의 작성자는 이를 오픈소스로 공개하여 트레이더들이 기능을 검토하고 검증할 수 있도록 했습니다. 작성자에게 찬사를 보냅니다! 이 코드는 무료로 사용할 수 있지만, 코드를 재게시하는 경우 하우스 룰이 적용된다는 점을 기억하세요.
면책사항
해당 정보와 게시물은 금융, 투자, 트레이딩 또는 기타 유형의 조언이나 권장 사항으로 간주되지 않으며, 트레이딩뷰에서 제공하거나 보증하는 것이 아닙니다. 자세한 내용은 이용 약관을 참조하세요.