Earlier this week, published an idea on how harmonic patterns can be used for trend following. This script is an attempt to implement the same.
🎲 Process
🎯 Derive Zigzag and scan harmonic patterns for last 5 confirmed pivots
🎯 If a pattern is found, highest point of pattern will become the bullish zone and lower point of the pattern will become bearish zone.
🎯 Since it is trend following method, when price reaches bullish zone, then the trend is considered as bullish and when price reaches bearish zone, the trend is considered as bearish.
🎯 If price does not touch both regions, then trend remains unchanged.
🎯 Bullish and bearish zone will change as and when new patterns are formed.
🎲 Note
Patterns are not created on latest pivot as last pivot will be unconfirmed and moving. Due to this, patterns appear after certain delay - patterns will not be real time. But, this is expected and does not impact the overall process.
When new pattern formed
https://www.tradingview.com/x/gGYDQ0xq/
When price breaks over the zones
https://www.tradingview.com/x/rJjgkJ0Y/
🎲 Output
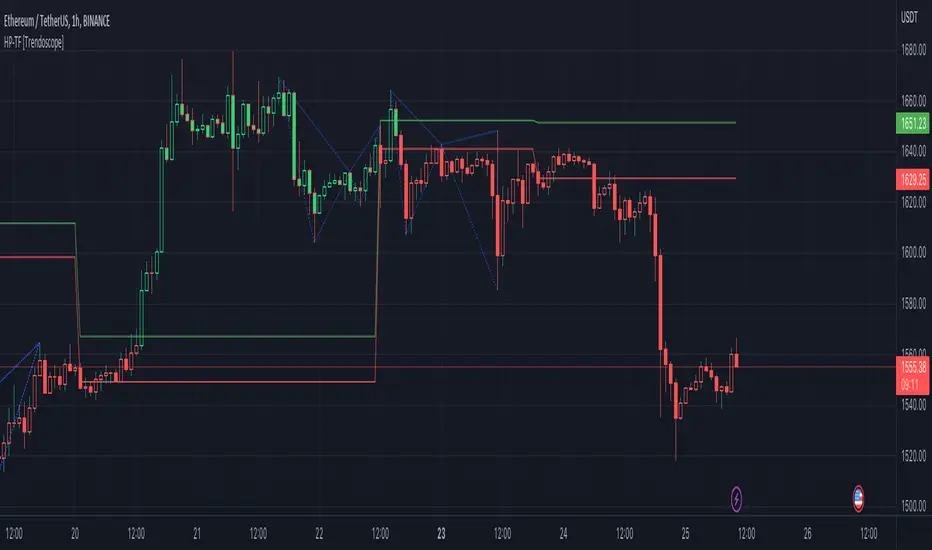
🎯 Patterns formed are drawn in blue coloured lines. Due to pine limitation of max 500 lines, older patterns automatically get deleted when new ones come.
🎯 Bullish Zone and Bearish Zone are plotted in green and red colours and the zone will change whenever new pattern comes along.
🎯 Bar colors are changed according to calculated trend. Trend value can be 1 or -1 based on the current trend. You can also find the value in data window.
🎯 For simplicity purpose, input option for selection of specific patterns are not provided and also pattern names are not displayed on the chart.
🎲 Process
🎯 Derive Zigzag and scan harmonic patterns for last 5 confirmed pivots
🎯 If a pattern is found, highest point of pattern will become the bullish zone and lower point of the pattern will become bearish zone.
🎯 Since it is trend following method, when price reaches bullish zone, then the trend is considered as bullish and when price reaches bearish zone, the trend is considered as bearish.
🎯 If price does not touch both regions, then trend remains unchanged.
🎯 Bullish and bearish zone will change as and when new patterns are formed.
🎲 Note
Patterns are not created on latest pivot as last pivot will be unconfirmed and moving. Due to this, patterns appear after certain delay - patterns will not be real time. But, this is expected and does not impact the overall process.
When new pattern formed
https://www.tradingview.com/x/gGYDQ0xq/
When price breaks over the zones
https://www.tradingview.com/x/rJjgkJ0Y/
🎲 Output
🎯 Patterns formed are drawn in blue coloured lines. Due to pine limitation of max 500 lines, older patterns automatically get deleted when new ones come.
🎯 Bullish Zone and Bearish Zone are plotted in green and red colours and the zone will change whenever new pattern comes along.
🎯 Bar colors are changed according to calculated trend. Trend value can be 1 or -1 based on the current trend. You can also find the value in data window.
🎯 For simplicity purpose, input option for selection of specific patterns are not provided and also pattern names are not displayed on the chart.
릴리즈 노트
Updated code to have more input options to determine bullish and bearish range.릴리즈 노트
Update signature :)릴리즈 노트
Added option to use log scale.오픈 소스 스크립트
트레이딩뷰의 진정한 정신에 따라, 이 스크립트의 작성자는 이를 오픈소스로 공개하여 트레이더들이 기능을 검토하고 검증할 수 있도록 했습니다. 작성자에게 찬사를 보냅니다! 이 코드는 무료로 사용할 수 있지만, 코드를 재게시하는 경우 하우스 룰이 적용된다는 점을 기억하세요.
Trial - trendoscope.io/trial
Subscribe - trendoscope.io/pricing
Blog - docs.trendoscope.io
Subscribe - trendoscope.io/pricing
Blog - docs.trendoscope.io
면책사항
해당 정보와 게시물은 금융, 투자, 트레이딩 또는 기타 유형의 조언이나 권장 사항으로 간주되지 않으며, 트레이딩뷰에서 제공하거나 보증하는 것이 아닙니다. 자세한 내용은 이용 약관을 참조하세요.
오픈 소스 스크립트
트레이딩뷰의 진정한 정신에 따라, 이 스크립트의 작성자는 이를 오픈소스로 공개하여 트레이더들이 기능을 검토하고 검증할 수 있도록 했습니다. 작성자에게 찬사를 보냅니다! 이 코드는 무료로 사용할 수 있지만, 코드를 재게시하는 경우 하우스 룰이 적용된다는 점을 기억하세요.
Trial - trendoscope.io/trial
Subscribe - trendoscope.io/pricing
Blog - docs.trendoscope.io
Subscribe - trendoscope.io/pricing
Blog - docs.trendoscope.io
면책사항
해당 정보와 게시물은 금융, 투자, 트레이딩 또는 기타 유형의 조언이나 권장 사항으로 간주되지 않으며, 트레이딩뷰에서 제공하거나 보증하는 것이 아닙니다. 자세한 내용은 이용 약관을 참조하세요.