OPEN-SOURCE SCRIPT
업데이트됨 [blackcat] L1 Fibonacci Counter
Level: 1
Background
I believe that many traders must be familiar with the Fibonacci sequence. In live trading, we also use the Fibonacci sequence to predict the probability of a change in direction at an important stage of the market. , In the market analysis method, the Fibonacci sequence appears frequently.
Function
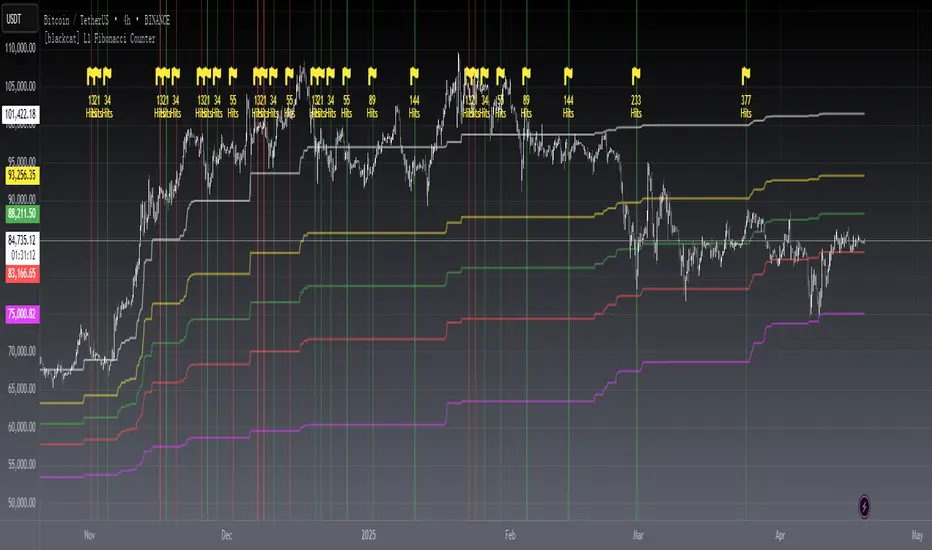
Drawing Fibonacci cycles manually is usually more labor-intensive. Here I tentatively implement a technical indicator that automatically draws Fibonacci time windows. It can automatically locate the high and low points of historical prices, and count them. When the period displayed by the counter is a Fibonacci number, it will be highlighted with a yellow background color and marked with the Fibonacci number. value.
Inputs
Counter Max Lookback --> Default 987.
Key Signal
Red bgcolor --> historical high with Fib hits
Green bgcolor --> historical low with Fib hits
Remarks
This is a Level 1 free and open source indicator.
Feedbacks are appreciated.
Background
I believe that many traders must be familiar with the Fibonacci sequence. In live trading, we also use the Fibonacci sequence to predict the probability of a change in direction at an important stage of the market. , In the market analysis method, the Fibonacci sequence appears frequently.
Function
Drawing Fibonacci cycles manually is usually more labor-intensive. Here I tentatively implement a technical indicator that automatically draws Fibonacci time windows. It can automatically locate the high and low points of historical prices, and count them. When the period displayed by the counter is a Fibonacci number, it will be highlighted with a yellow background color and marked with the Fibonacci number. value.
Inputs
Counter Max Lookback --> Default 987.
Key Signal
Red bgcolor --> historical high with Fib hits
Green bgcolor --> historical low with Fib hits
Remarks
This is a Level 1 free and open source indicator.
Feedbacks are appreciated.
릴리즈 노트
OVERVIEWThe [blackcat] L1 Fibonacci Counter is a powerful tool designed to help traders identify key Fibonacci retracement levels and detect significant price movements based on these levels. This indicator calculates and plots multiple Fibonacci levels using exponential moving averages (EMAs), providing valuable insights into potential support and resistance zones. Additionally, it highlights important Fibonacci sequence hits on the chart for enhanced visualization 📊💡.
FEATURES
Customizable Max Lookback Period to adjust the range of historical data considered 🕒
Calculates and plots key Fibonacci retracement levels:
19.1%
38.2%
50% (midpoint)
61.8%
80.9%
Highlights detected Fibonacci sequence hits with markers and background colors:
13 Hits
21 Hits
34 Hits
55 Hits
89 Hits
144 Hits
233 Hits
377 Hits
Uses exponential moving averages (EMAs) for smoother and more reliable level plotting 📈
HOW TO USE
Add the indicator to your TradingView chart by selecting it from the indicators list.
Adjust the Max Lookback Period input according to your preference and market conditions ⚙️.
Monitor the chart for plotted Fibonacci levels and highlighted Fibonacci hits indicating potential support/resistance zones and significant price movements.
Use these levels in conjunction with other technical analysis tools for better decision-making.
LIMITATIONS
The effectiveness of the indicator may vary depending on the chosen Max Lookback Period.
False signals can occur in highly volatile or ranging markets 🌪️.
Users should combine this indicator with other forms of analysis for better results.
NOTES
The script imports external libraries (e.g., pandas_ta) for additional functionalities.
Ensure that you have sufficient historical data available for accurate calculations.
Test the indicator thoroughly on demo accounts before applying it to live trading 🔍.
오픈 소스 스크립트
트레이딩뷰의 진정한 정신에 따라, 이 스크립트의 작성자는 이를 오픈소스로 공개하여 트레이더들이 기능을 검토하고 검증할 수 있도록 했습니다. 작성자에게 찬사를 보냅니다! 이 코드는 무료로 사용할 수 있지만, 코드를 재게시하는 경우 하우스 룰이 적용된다는 점을 기억하세요.
Avoid losing contact!Don't miss out! The first and most important thing to do is to join my Discord chat now! Click here to start your adventure: discord.com/invite/ZTGpQJq 防止失联,请立即行动,加入本猫聊天群: discord.com/invite/ZTGpQJq
면책사항
해당 정보와 게시물은 금융, 투자, 트레이딩 또는 기타 유형의 조언이나 권장 사항으로 간주되지 않으며, 트레이딩뷰에서 제공하거나 보증하는 것이 아닙니다. 자세한 내용은 이용 약관을 참조하세요.