PROTECTED SOURCE SCRIPT
Market Divergence (Line version) ©MBYLAB
Good morning.
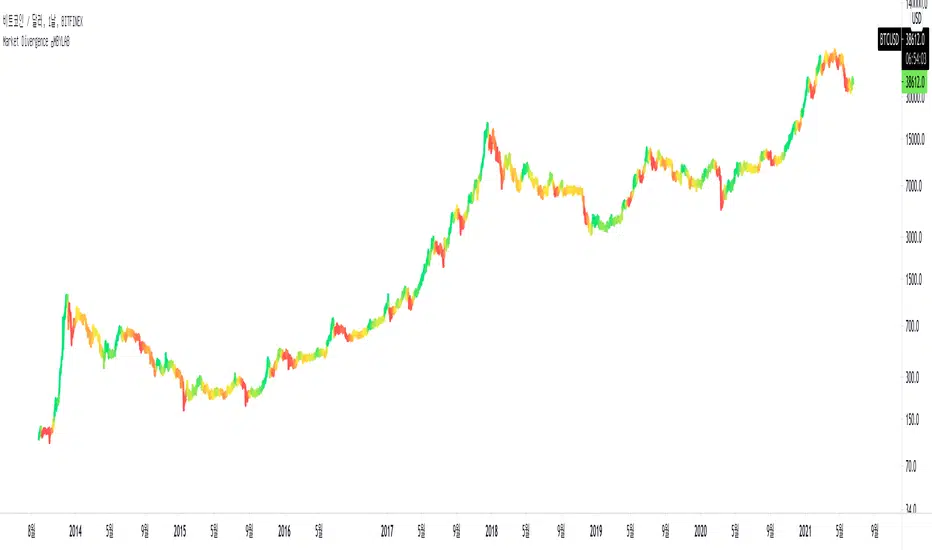
This indicator measures the distance between the moving average line and the current price position, so you can check the price divergence.
logic
In general, when the closing price breaks below the moving average and closes, it can be interpreted as downward divergence.
Based on the logic described above, this indicator will have a darker color as the current price position is further away from the set moving average.
When this indicator starts changing from red to yellow, it can be interpreted that the trend is reversing.(Bearish -> Bullish)
How to use
First, set the existing candle chart in the upper left to invisible and then apply the corresponding indicator.
Anyone can use this indicator, no special conditions are required.
보호된 스크립트입니다
이 스크립트는 비공개 소스로 게시됩니다. 하지만 이를 자유롭게 제한 없이 사용할 수 있습니다 – 자세한 내용은 여기에서 확인하세요.
Hi, im Quant from KR
면책사항
해당 정보와 게시물은 금융, 투자, 트레이딩 또는 기타 유형의 조언이나 권장 사항으로 간주되지 않으며, 트레이딩뷰에서 제공하거나 보증하는 것이 아닙니다. 자세한 내용은 이용 약관을 참조하세요.
보호된 스크립트입니다
이 스크립트는 비공개 소스로 게시됩니다. 하지만 이를 자유롭게 제한 없이 사용할 수 있습니다 – 자세한 내용은 여기에서 확인하세요.
Hi, im Quant from KR
면책사항
해당 정보와 게시물은 금융, 투자, 트레이딩 또는 기타 유형의 조언이나 권장 사항으로 간주되지 않으며, 트레이딩뷰에서 제공하거나 보증하는 것이 아닙니다. 자세한 내용은 이용 약관을 참조하세요.