PROTECTED SOURCE SCRIPT
Combined EMA + RSI + Stochastic RSI
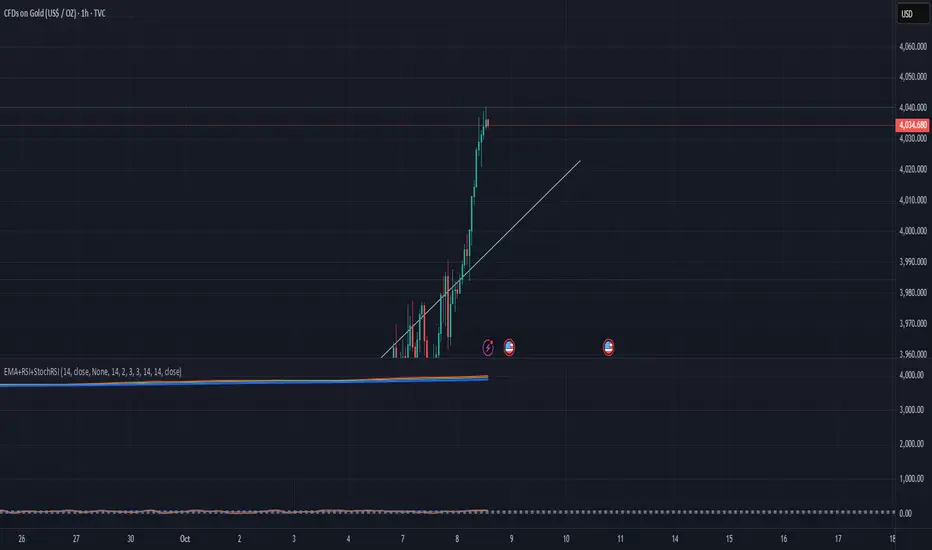
⚙️ Combined EMA + RSI + Stochastic RSI Indicator
This indicator merges three powerful technical tools — EMA, RSI, and Stochastic RSI — to help traders identify trend direction, strength, and potential reversal zones all in one view.
EMA (Exponential Moving Average):
Shows the overall market trend. When price stays above the EMA, it signals bullish momentum; below the EMA indicates bearish pressure.
RSI (Relative Strength Index):
Measures momentum and overbought/oversold conditions, helping identify when a trend may be losing strength.
Stochastic RSI:
Adds a faster, more sensitive oscillator, giving early signals of potential reversals or pullbacks within the main trend.
보호된 스크립트입니다
이 스크립트는 비공개 소스로 게시됩니다. 하지만 제한 없이 자유롭게 사용할 수 있습니다 — 여기에서 자세히 알아보기.
면책사항
이 정보와 게시물은 TradingView에서 제공하거나 보증하는 금융, 투자, 거래 또는 기타 유형의 조언이나 권고 사항을 의미하거나 구성하지 않습니다. 자세한 내용은 이용 약관을 참고하세요.
보호된 스크립트입니다
이 스크립트는 비공개 소스로 게시됩니다. 하지만 제한 없이 자유롭게 사용할 수 있습니다 — 여기에서 자세히 알아보기.
면책사항
이 정보와 게시물은 TradingView에서 제공하거나 보증하는 금융, 투자, 거래 또는 기타 유형의 조언이나 권고 사항을 의미하거나 구성하지 않습니다. 자세한 내용은 이용 약관을 참고하세요.