OPEN-SOURCE SCRIPT
RS Rating for Indian Market
RS Rating for Trading View
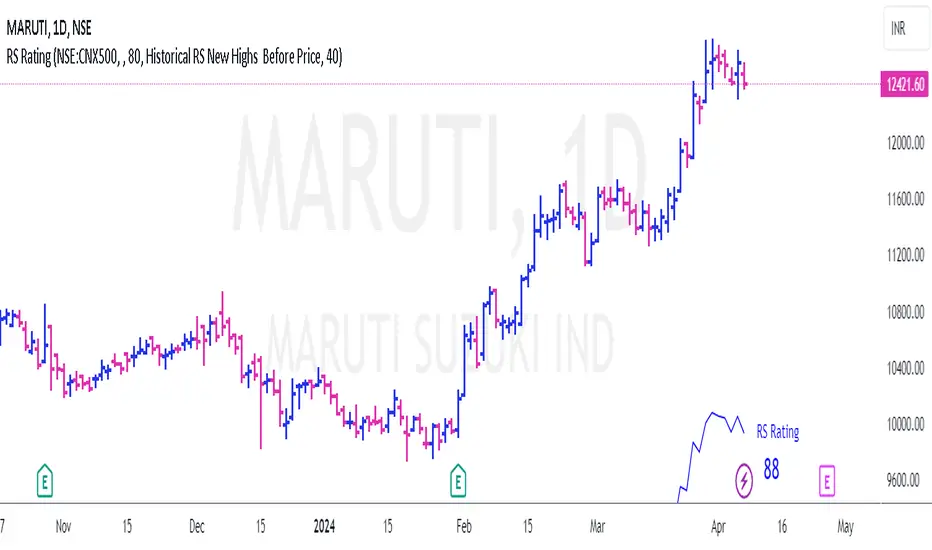
This Trading View script calculates the Relative Price Strength (RS) Rating for a given stock. It's a measure of a stock's price performance over the last twelve months, compared to all stocks in a selected Index. The rating scale ranges from 1 (lowest) to 99 (highest).
Features
- Adaptation for Indian Market
- Option to choose the index to compare to (NSE:NIFTY, NSE:CNX500, NSE:NIFTYSMLCAP250, NSE:CNXSMALLCAP)
- Option to compare to a different index
- Option to hide the RS rating
- Option to plot RS new highs
- Option to adjust the offset of the line for display purposes
- Option to change the color of the RS Line & Rating
- Option to change the color of the dots for RS new highs
- Option to choose which new high to plot (RS New Highs, RS New Highs Before Price, Historical RS New Highs, Historical RS New Highs Before Price)
- Option to adjust the recent high look-back count
Please note that the script is designed to work best in the daily timeframe. Results may not be accurate in other timeframes.
This script uses three methods to calculate the RS Rating:
1. A method that calculates how the stock behaves vs SMA.
2. A classic performance method that calculates the performance of the stock's closing price vs the closing price 3 months back.
3. A method that measures how the stock performs against the comparative Symbol.
The final RS Rating is a combination of the results from these three methods. The script also includes some adjustments based on observations to improve the accuracy of the rating.
오픈 소스 스크립트
트레이딩뷰의 진정한 정신에 따라, 이 스크립트의 작성자는 이를 오픈소스로 공개하여 트레이더들이 기능을 검토하고 검증할 수 있도록 했습니다. 작성자에게 찬사를 보냅니다! 이 코드는 무료로 사용할 수 있지만, 코드를 재게시하는 경우 하우스 룰이 적용된다는 점을 기억하세요.
면책사항
해당 정보와 게시물은 금융, 투자, 트레이딩 또는 기타 유형의 조언이나 권장 사항으로 간주되지 않으며, 트레이딩뷰에서 제공하거나 보증하는 것이 아닙니다. 자세한 내용은 이용 약관을 참조하세요.
오픈 소스 스크립트
트레이딩뷰의 진정한 정신에 따라, 이 스크립트의 작성자는 이를 오픈소스로 공개하여 트레이더들이 기능을 검토하고 검증할 수 있도록 했습니다. 작성자에게 찬사를 보냅니다! 이 코드는 무료로 사용할 수 있지만, 코드를 재게시하는 경우 하우스 룰이 적용된다는 점을 기억하세요.
면책사항
해당 정보와 게시물은 금융, 투자, 트레이딩 또는 기타 유형의 조언이나 권장 사항으로 간주되지 않으며, 트레이딩뷰에서 제공하거나 보증하는 것이 아닙니다. 자세한 내용은 이용 약관을 참조하세요.