OPEN-SOURCE SCRIPT
Anomaly Detector
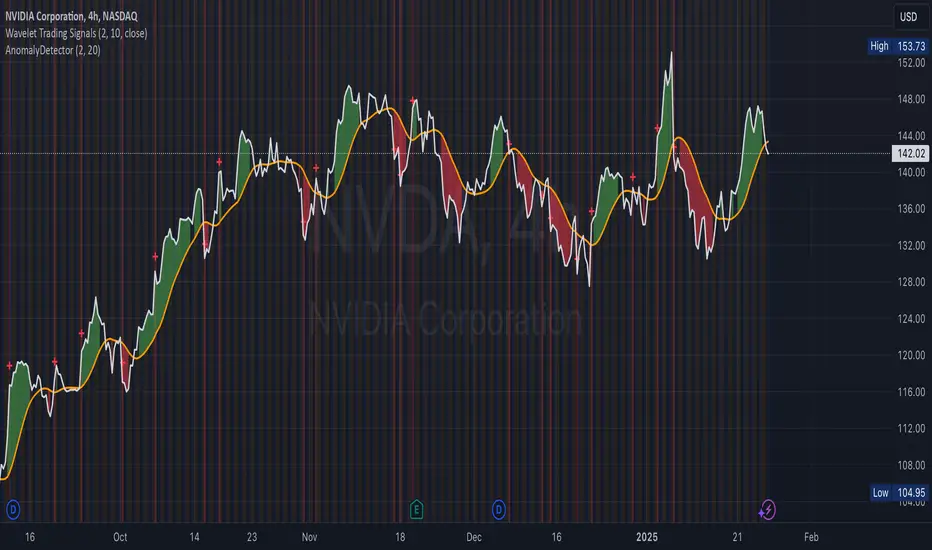
Price Anomaly Detector
This is a script designed to identify unusual price movements. By analyzing deviations from typical price behavior, this tool helps traders spot potential trading opportunities and manage risks effectively.
---
Features
- Anomaly Detection: Flags price points that significantly deviate from the average.
- Visual Indicators: Highlights anomalies with background colors and cross markers.
- Customizable Settings: Adjust sensitivity and window size to match your trading strategy.
- Real-Time Analysis: Continuously updates anomaly signals as new data is received.
---
Usage
After adding the indicator to your chart:
1. View Anomalies: Red backgrounds and cross markers indicate detected anomalies.
2. Adjust Settings: Modify the `StdDev Threshold` and `Window Length` to change detection sensitivity.
3. Interpret Signals:
- Red Background: Anomaly detected on that bar.
- Red Cross: Specific point of anomaly.
---
Inputs
- StdDev Threshold: Higher values reduce anomaly sensitivity. Default: 2.0.
- Window Length: Larger windows smooth data, reducing false positives. Default: 20.
---
Limitations
- Approximation Method: Uses a simple method to detect anomalies, which may not capture all types of unusual price movements.
- Performance: Extremely large window sizes may impact script performance.
- Segment Detection: Does not group consecutive anomalies into segments.
---
Disclaimer: This tool is for educational purposes only. Trading involves risk, and you should perform your own analysis before making decisions. The author is not liable for any losses incurred.
오픈 소스 스크립트
트레이딩뷰의 진정한 정신에 따라, 이 스크립트의 작성자는 이를 오픈소스로 공개하여 트레이더들이 기능을 검토하고 검증할 수 있도록 했습니다. 작성자에게 찬사를 보냅니다! 이 코드는 무료로 사용할 수 있지만, 코드를 재게시하는 경우 하우스 룰이 적용된다는 점을 기억하세요.
면책사항
해당 정보와 게시물은 금융, 투자, 트레이딩 또는 기타 유형의 조언이나 권장 사항으로 간주되지 않으며, 트레이딩뷰에서 제공하거나 보증하는 것이 아닙니다. 자세한 내용은 이용 약관을 참조하세요.
오픈 소스 스크립트
트레이딩뷰의 진정한 정신에 따라, 이 스크립트의 작성자는 이를 오픈소스로 공개하여 트레이더들이 기능을 검토하고 검증할 수 있도록 했습니다. 작성자에게 찬사를 보냅니다! 이 코드는 무료로 사용할 수 있지만, 코드를 재게시하는 경우 하우스 룰이 적용된다는 점을 기억하세요.
면책사항
해당 정보와 게시물은 금융, 투자, 트레이딩 또는 기타 유형의 조언이나 권장 사항으로 간주되지 않으며, 트레이딩뷰에서 제공하거나 보증하는 것이 아닙니다. 자세한 내용은 이용 약관을 참조하세요.