INVITE-ONLY SCRIPT
High volume bar by Vibie
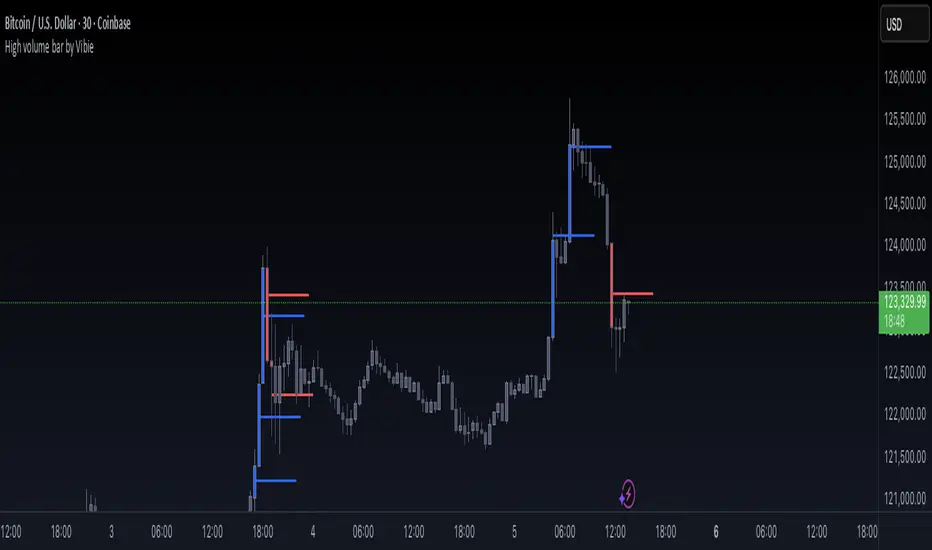
High Volume Bar with Extended vPOC (Aggregation Enabled)
🧠 Concept
This indicator is designed to detect institutional activity and large traders by using statistical volume analysis and identifying key intrabar liquidity levels.
It applies Z-Score volume analysis to highlight unusually high volume candles and marks the Volume Point of Control (vPOC) inside each detected bar — the price level where the most volume was transacted.
⸻
⚙️ How It Works
1. Z-Score Volume Analysis
• The indicator calculates how far current volume deviates from its historical average using standard deviations (Z-Score).
• When the Z-Score exceeds the user-defined threshold, the candle is flagged as a High Volume Bar (HVB).
2. Multi-Exchange Aggregation
• Volumes from Binance, Bybit, and Coinbase can be aggregated into a composite volume metric.
• This provides a broader and more accurate market perspective, minimizing anomalies from individual exchanges.
3. Candle Coloring
• Bullish HVB → entire candle (body + wicks) is colored blue.
• Bearish HVB → entire candle is colored red.
• This makes large volume events immediately visible on the chart.
4. vPOC Detection
• The script examines a lower timeframe (e.g., 1 minute) within the HVB to find the price level with the highest traded volume.
• A horizontal line is drawn at that price and can be extended for multiple bars, marking a short-term liquidity zone that often acts as support or resistance.
⸻
🧭 How to Use
• vPOC levels frequently act as liquidity magnets and are often retested after the HVB appears.
• Bullish HVB + vPOC below current price = potential long entry zone.
• Bearish HVB + vPOC above price = potential short entry zone.
• Useful for identifying institutional absorption, stop runs, or hidden accumulation/distribution.
⸻
🌟 Why It’s Original and Useful
• Combines statistical volume analysis (Z-Score) with intrabar volume profiling.
• Aggregates multiple exchanges for broader accuracy.
• Offers precise liquidity levels that classic indicators don’t provide.
• Especially valuable for advanced traders looking for institutional footprints.
초대 전용 스크립트
이 스크립트는 작성자가 승인한 사용자만 접근할 수 있습니다. 사용하려면 요청 후 승인을 받아야 하며, 일반적으로 결제 후에 허가가 부여됩니다. 자세한 내용은 아래 작성자의 안내를 따르거나 ivek에게 직접 문의하세요.
트레이딩뷰는 스크립트의 작동 방식을 충분히 이해하고 작성자를 완전히 신뢰하지 않는 이상, 해당 스크립트에 비용을 지불하거나 사용하는 것을 권장하지 않습니다. 커뮤니티 스크립트에서 무료 오픈소스 대안을 찾아보실 수도 있습니다.
작성자 지시 사항
Access to this script is restricted.
To get access, please follow these steps:
1. Go to my TradingView profile.
2. Click the “Send message” button.
3. Write a short message requesting access to this specific script (include the script name).
4. Access
면책사항
해당 정보와 게시물은 금융, 투자, 트레이딩 또는 기타 유형의 조언이나 권장 사항으로 간주되지 않으며, 트레이딩뷰에서 제공하거나 보증하는 것이 아닙니다. 자세한 내용은 이용 약관을 참조하세요.