OPEN-SOURCE SCRIPT
Disparity Index
The Disparity Index is a technical momentum indicator that measures the relative position of the most recent closing price to a selected moving average. It calculates the percentage difference between the closing price and the moving average, providing insights into price momentum and potential reversals.
The formula for the Disparity Index is: [(Close - n-period MA) / n-period MA] * 100, where Close is the most recent closing price and n-period MA is the chosen moving average over n periods.
The Disparity Index can be used in various ways:
Trend Identification: The Disparity Index helps identify the relationship between the price and a chosen moving average. A positive value indicates that the price is above the moving average, suggesting bullish momentum, while a negative value suggests bearish momentum.
Overbought and Oversold Conditions: The Disparity Index can be used to identify potential overbought and oversold conditions. When the index reaches an extremely high value, it may indicate an overbought condition, implying a possible price correction. Conversely, an extremely low value can signal an oversold condition, indicating a potential price rebound.
Divergence: Traders can use the Disparity Index to identify divergence between the price and the indicator. Divergence occurs when the price and the Disparity Index move in opposite directions, potentially signaling an upcoming price reversal.
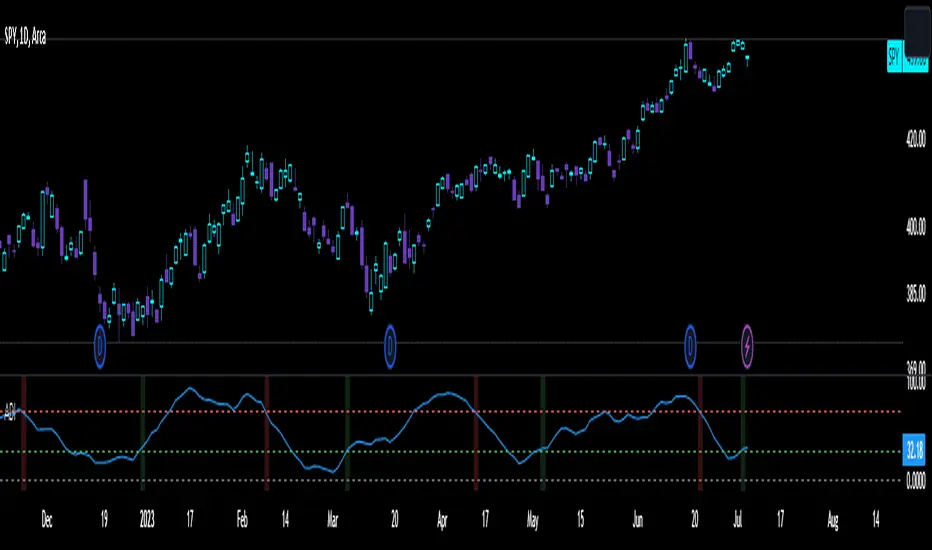
Personal Strategy: When the Disparity Index generates a green background, it suggests a potential bullish signal. This occurs when the Disparity Index crosses above the oversold threshold or exhibits a bullish reversal pattern. The green background signifies an area where buyers may have gained control, indicating a favorable environment for initiating long positions. This approach allows you to capitalize on potential upward price movements and join the uptrend.
On the other hand, when the Disparity Index generates a red background, it implies a potential bearish signal. This occurs when the Disparity Index crosses below the overbought threshold or exhibits a bearish reversal pattern. The red background highlights a zone where sellers might dominate, indicating a higher likelihood of downward price movements. By considering selling opportunities in these zones, you can position yourself to profit from potential downside moves and align with the prevailing downtrend.
The Disparity Index can be customized by using different types of moving averages such as simple moving averages (SMAs), exponential moving averages (EMAs), or weighted moving averages (WMAs). Additionally, it can be smoothed using another moving average to reduce noise and generate smoother signals, improving trend identification.
In trending markets, the Disparity Index is particularly effective as a trend indicator due to its ability to quickly capture price changes. It can provide early indications of trend strength and potential reversals, allowing traders to enter or exit positions in a timely manner. This advantage over traditional moving averages makes the Disparity Index a valuable tool for trend-following strategies.
Enjoy!
The formula for the Disparity Index is: [(Close - n-period MA) / n-period MA] * 100, where Close is the most recent closing price and n-period MA is the chosen moving average over n periods.
The Disparity Index can be used in various ways:
Trend Identification: The Disparity Index helps identify the relationship between the price and a chosen moving average. A positive value indicates that the price is above the moving average, suggesting bullish momentum, while a negative value suggests bearish momentum.
Overbought and Oversold Conditions: The Disparity Index can be used to identify potential overbought and oversold conditions. When the index reaches an extremely high value, it may indicate an overbought condition, implying a possible price correction. Conversely, an extremely low value can signal an oversold condition, indicating a potential price rebound.
Divergence: Traders can use the Disparity Index to identify divergence between the price and the indicator. Divergence occurs when the price and the Disparity Index move in opposite directions, potentially signaling an upcoming price reversal.
Personal Strategy: When the Disparity Index generates a green background, it suggests a potential bullish signal. This occurs when the Disparity Index crosses above the oversold threshold or exhibits a bullish reversal pattern. The green background signifies an area where buyers may have gained control, indicating a favorable environment for initiating long positions. This approach allows you to capitalize on potential upward price movements and join the uptrend.
On the other hand, when the Disparity Index generates a red background, it implies a potential bearish signal. This occurs when the Disparity Index crosses below the overbought threshold or exhibits a bearish reversal pattern. The red background highlights a zone where sellers might dominate, indicating a higher likelihood of downward price movements. By considering selling opportunities in these zones, you can position yourself to profit from potential downside moves and align with the prevailing downtrend.
The Disparity Index can be customized by using different types of moving averages such as simple moving averages (SMAs), exponential moving averages (EMAs), or weighted moving averages (WMAs). Additionally, it can be smoothed using another moving average to reduce noise and generate smoother signals, improving trend identification.
In trending markets, the Disparity Index is particularly effective as a trend indicator due to its ability to quickly capture price changes. It can provide early indications of trend strength and potential reversals, allowing traders to enter or exit positions in a timely manner. This advantage over traditional moving averages makes the Disparity Index a valuable tool for trend-following strategies.
Enjoy!
오픈 소스 스크립트
트레이딩뷰의 진정한 정신에 따라, 이 스크립트의 작성자는 이를 오픈소스로 공개하여 트레이더들이 기능을 검토하고 검증할 수 있도록 했습니다. 작성자에게 찬사를 보냅니다! 이 코드는 무료로 사용할 수 있지만, 코드를 재게시하는 경우 하우스 룰이 적용된다는 점을 기억하세요.
면책사항
해당 정보와 게시물은 금융, 투자, 트레이딩 또는 기타 유형의 조언이나 권장 사항으로 간주되지 않으며, 트레이딩뷰에서 제공하거나 보증하는 것이 아닙니다. 자세한 내용은 이용 약관을 참조하세요.
오픈 소스 스크립트
트레이딩뷰의 진정한 정신에 따라, 이 스크립트의 작성자는 이를 오픈소스로 공개하여 트레이더들이 기능을 검토하고 검증할 수 있도록 했습니다. 작성자에게 찬사를 보냅니다! 이 코드는 무료로 사용할 수 있지만, 코드를 재게시하는 경우 하우스 룰이 적용된다는 점을 기억하세요.
면책사항
해당 정보와 게시물은 금융, 투자, 트레이딩 또는 기타 유형의 조언이나 권장 사항으로 간주되지 않으며, 트레이딩뷰에서 제공하거나 보증하는 것이 아닙니다. 자세한 내용은 이용 약관을 참조하세요.