OPEN-SOURCE SCRIPT
Multi timeframe trend
DESCRIPTION
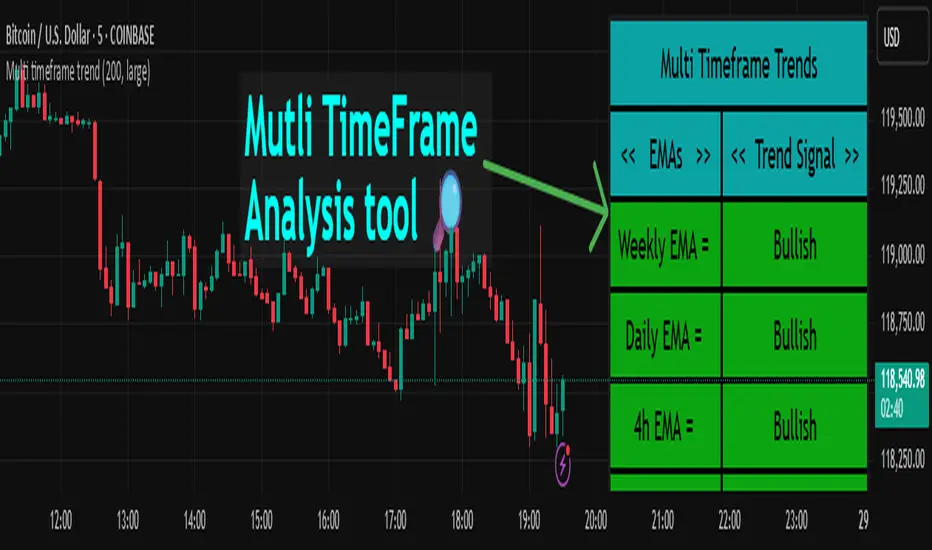
This indicator, Multi Timeframe Trend, is a powerful tool designed to give traders a comprehensive overview of market trends across multiple timeframes using a single, customizable Exponential Moving Average (EMA). It visually displays whether the price is trading above or below the EMA on each timeframe, helping traders quickly determine the dominant trend at a glance.
The real-time dashboard is plotted directly on your chart and color-coded to show bullish (green) or bearish (red) conditions per timeframe, from 15 minutes to 1 week. It is especially helpful for identifying trend alignment across multiple timeframes—an essential component of many professional trading strategies.
USER INPUTS
* Enter the EMA length – Adjust the EMA period used in the trend calculation (default: 200)
* Table Size – Choose how large the on-chart table appears: "tiny", "small", "normal", or "large"
INDICATOR LOGIC
* The indicator calculates the EMA for each of the following timeframes: 1W, 1D, 4H, 1H, 30M, and 15M
* It checks whether the current close is above or below each EMA and labels it as:
* Bullish if close > EMA
* Bearish if close < EMA
* Each timeframe’s trend is displayed in a dynamic table in the top-right corner of the chart
* The background color of each cell changes according to trend condition for quick visual interpretation
* Real-time responsiveness: handles both historical and live bars to maintain accurate, flicker-free updates
WHY IT IS UNIQUE
* Combines multiple timeframe trend analysis into a single glance
* Clean and color-coded dashboard overlay for real-time trading decisions
* Avoids repainting using barstate logic for accurate trend updates
* Fully customizable table size and EMA length
* Works on any chart, including stocks, crypto, forex, indices
HOW USERS CAN BENEFIT FROM IT
* Multi-timeframe confirmation: Easily confirm alignment across timeframes before entering a trade
* Avoid false signals by ensuring higher timeframe trends agree with lower timeframe setups
* Enhance strategy filters: Use as a trend filter in combination with your existing entry indicators
* Quick market analysis: No need to switch between charts or manually calculate EMAs
* Visual clarity: Trend conditions are easy to read and interpret in real-time
오픈 소스 스크립트
트레이딩뷰의 진정한 정신에 따라, 이 스크립트의 작성자는 이를 오픈소스로 공개하여 트레이더들이 기능을 검토하고 검증할 수 있도록 했습니다. 작성자에게 찬사를 보냅니다! 이 코드는 무료로 사용할 수 있지만, 코드를 재게시하는 경우 하우스 룰이 적용된다는 점을 기억하세요.
Shivam mandai
면책사항
해당 정보와 게시물은 금융, 투자, 트레이딩 또는 기타 유형의 조언이나 권장 사항으로 간주되지 않으며, 트레이딩뷰에서 제공하거나 보증하는 것이 아닙니다. 자세한 내용은 이용 약관을 참조하세요.
오픈 소스 스크립트
트레이딩뷰의 진정한 정신에 따라, 이 스크립트의 작성자는 이를 오픈소스로 공개하여 트레이더들이 기능을 검토하고 검증할 수 있도록 했습니다. 작성자에게 찬사를 보냅니다! 이 코드는 무료로 사용할 수 있지만, 코드를 재게시하는 경우 하우스 룰이 적용된다는 점을 기억하세요.
Shivam mandai
면책사항
해당 정보와 게시물은 금융, 투자, 트레이딩 또는 기타 유형의 조언이나 권장 사항으로 간주되지 않으며, 트레이딩뷰에서 제공하거나 보증하는 것이 아닙니다. 자세한 내용은 이용 약관을 참조하세요.