PROTECTED SOURCE SCRIPT
@unlcesyp smart wick reversal
@unlcesyp smart wick reversal
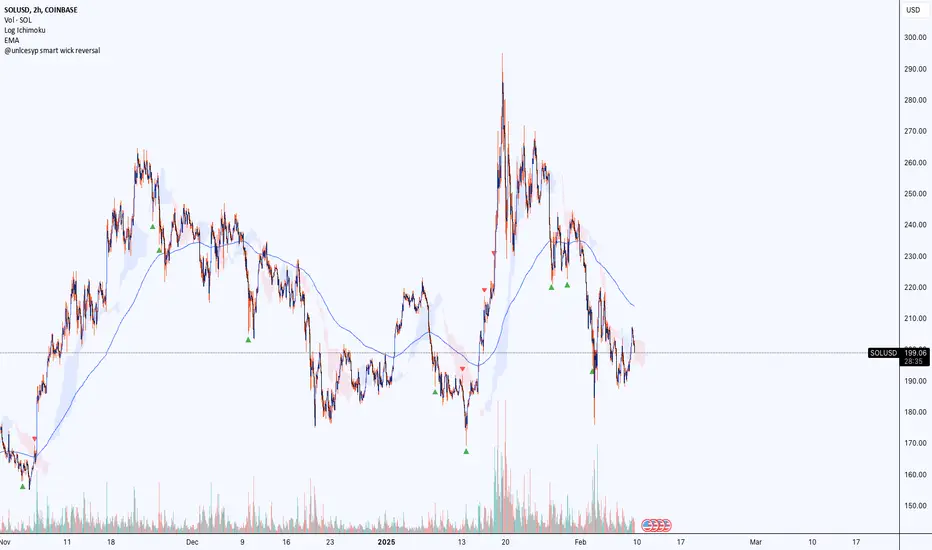
This indicator helps you spot potential market reversals by highlighting abnormal wicks that often signal a turning point. It adapts to changing market volatility and volume, making it more reliable across different market conditions.
How It Works
1. Wick Analysis
- Measures upper and lower wicks over a chosen lookback period.
- Calculates the average and standard deviation of these wicks, then flags “abnormally long” wicks.
2. Adaptive Volatility
- Uses an ATR-based volatility factor to adjust the wick threshold.
- In high-volatility conditions, the threshold is higher, reducing false signals.
3. Trend Check
- Select either an SMA or EMA to determine if the market is in an uptrend or downtrend.
- A large upper wick in an uptrend can signal bullish exhaustion (potential reversal down).
- A large lower wick in a downtrend can signal bearish exhaustion (potential reversal up).
4. Optional Volume Confirmation
- Checks if volume is above its average to ensure strong participation in the move.
- Helps filter out weak, low-volume signals.
5. Signals
- Red ▼ (triangle down) = Potential Bearish Reversal
- Green ▲ (triangle up) = Potential Bullish Reversal
Why Use It?
- Adaptive: Automatically adjusts to changes in market volatility.
- Flexible Trend Basis: Choose SMA or EMA for calculating market trend.
- Volume Filter: Adds an extra layer of confirmation.
- Clear Visuals: Marks potential reversals with simple, unobtrusive shapes.
Inputs Explained
1. Lookback Period for Wick Analysis (`length`)
- Default: 20
- Number of bars used to calculate wick averages. Higher values = smoother signals; lower values = more reactive.
2. ATR Length for Volatility Filtering (`atr_length`)
- Default: 14
- Number of bars the ATR uses to gauge volatility.
3. Base Threshold Multiplier (`base_multiplier`)
- Default: 2.0
- Multiplier for standard deviation of wicks. Higher = fewer (but potentially stronger) signals.
4. Volatility Sensitivity Factor (`volatility_sensitivity`)
- Default: 1.5
- Adjusts how much volatility affects the threshold. Higher = more adaptive; lower = more stable.
5. Enable Volume Confirmation (`volume_filter`)
- Default: true
- When enabled, signals only appear if volume exceeds its average by a specified multiplier.
6. Volume Spike Multiplier (`vol_multiplier`)
- Default: 1.5
- Determines how much above average volume must be to confirm a signal.
7. Trend Calculation Method (`trendMethod`)
- Options: “SMA” or “EMA”
- Determines the type of moving average to evaluate the market trend for exhaustion signals.
Best Practices
- Combine with other price action or technical indicators to confirm signals.
- Use on multiple timeframes for a broader market perspective.
- Adjust parameters (`length`, `atr_length`, `base_multiplier`) for different assets or personal preference.
보호된 스크립트입니다
이 스크립트는 비공개 소스로 게시됩니다. 하지만 이를 자유롭게 제한 없이 사용할 수 있습니다 – 자세한 내용은 여기에서 확인하세요.
면책사항
해당 정보와 게시물은 금융, 투자, 트레이딩 또는 기타 유형의 조언이나 권장 사항으로 간주되지 않으며, 트레이딩뷰에서 제공하거나 보증하는 것이 아닙니다. 자세한 내용은 이용 약관을 참조하세요.
면책사항
해당 정보와 게시물은 금융, 투자, 트레이딩 또는 기타 유형의 조언이나 권장 사항으로 간주되지 않으며, 트레이딩뷰에서 제공하거나 보증하는 것이 아닙니다. 자세한 내용은 이용 약관을 참조하세요.