PROTECTED SOURCE SCRIPT
QTheory [ SSMT ]
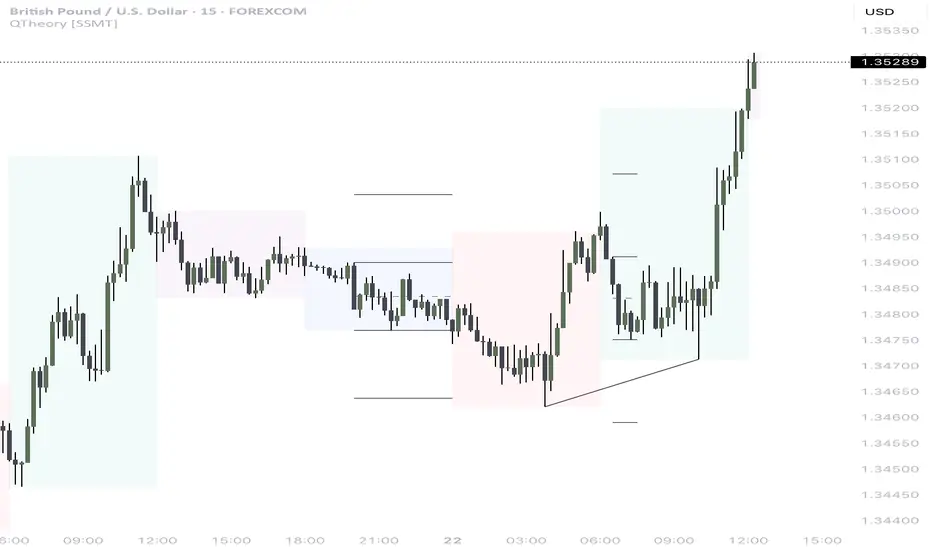
QTheory [SSMT] –
This indicator is built on Quarterly Theory (developed by Daye)
🔹 Quarterly Theory
Markets often unfold in repeating quarterly cycles (Q1–Q4) across multiple timeframes — yearly, monthly, weekly, daily, 90-minute, and even micro cycles. By dividing price action into these quarters, traders can better anticipate structural shifts, accumulation/distribution phases, and liquidity runs.
🔹 Sequential SMT (SSMT)
Sequential SMT extends standard SMT (Smart Money Technique) by comparing multiple assets (such as FX majors) to identify divergences across quarters.
🔹 Features of QTheory
Automatic detection of quarterly cycles across multiple timeframes.
Visual cycle boxes & customizable dividers.
Integrated SSMT signals with divergence line visualization.
DFR (Defining Range) with Fibonacci levels.
Support for up to 5 comparison assets, with inversion options.
Auto-cycle selection for seamless multi-timeframe adaptation.
Extensive customization for colors, opacity, and signal display.
🔹 How it works
QTheory divides price data into consistent “quarters” across multiple timeframes. Within each cycle, it tracks highs, lows, and divergences, then overlays this information as boxes, dividers, and optional signals on your chart. Traders can use these visual cues to better align entries and exits with institutional market behavior patterns.
🔹 How to use it
Enable the desired cycle type (e.g., weekly, daily, 90-minute) from the settings.
Toggle boxes, dividers, and signals depending on your trading style.
Use SSMT divergences and DFR Fibs to anticipate a reversal
Compare against other assets (e.g., DXY or correlated pairs) to refine confluence.
⚠️ Disclaimer: This tool is for educational purposes only. It does not constitute financial advice. Always perform your own analysis and risk management.
보호된 스크립트입니다
이 스크립트는 비공개 소스로 게시됩니다. 하지만 제한 없이 자유롭게 사용할 수 있습니다 — 여기에서 자세히 알아보기.
면책사항
이 정보와 게시물은 TradingView에서 제공하거나 보증하는 금융, 투자, 거래 또는 기타 유형의 조언이나 권고 사항을 의미하거나 구성하지 않습니다. 자세한 내용은 이용 약관을 참고하세요.
보호된 스크립트입니다
이 스크립트는 비공개 소스로 게시됩니다. 하지만 제한 없이 자유롭게 사용할 수 있습니다 — 여기에서 자세히 알아보기.
면책사항
이 정보와 게시물은 TradingView에서 제공하거나 보증하는 금융, 투자, 거래 또는 기타 유형의 조언이나 권고 사항을 의미하거나 구성하지 않습니다. 자세한 내용은 이용 약관을 참고하세요.