OPEN-SOURCE SCRIPT
BOS & ChoCh Market Structure
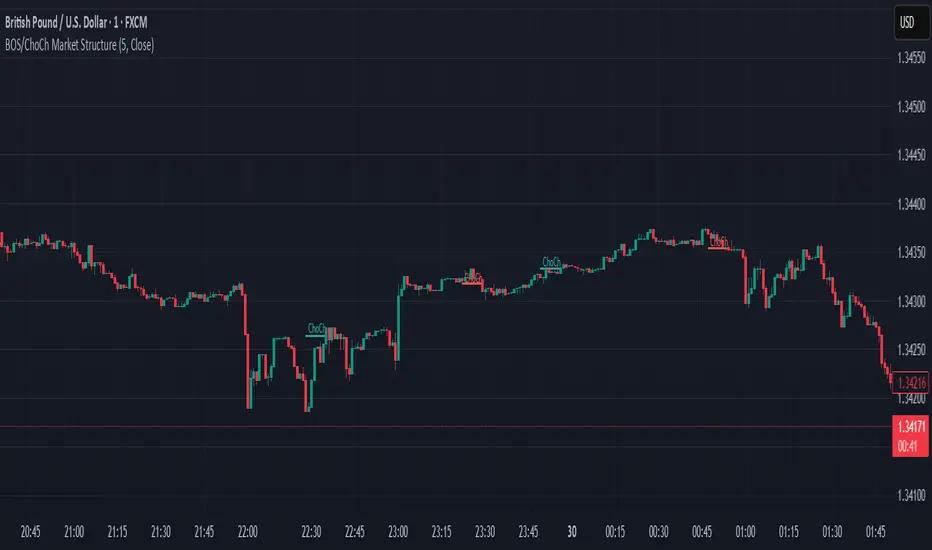
BOS/ChoCh Market Structure Indicator
This indicator identifies key market structure shifts using Break of Structure (BOS) and Change of Character (ChoCh) signals based on pivot point analysis.
Concept
Break of Structure (BOS) occurs when price breaks through a significant pivot level in the direction of the current trend, signaling trend continuation. A bullish BOS happens when price breaks above a pivot high while in an uptrend, while a bearish BOS occurs when price breaks below a pivot low during a downtrend.
Change of Character (ChoCh) signals a potential trend reversal. It occurs when price breaks against the prevailing trend - breaking above a pivot high while in a downtrend, or breaking below a pivot low while in an uptrend. This indicates the market structure is shifting.
How It Works
The indicator automatically detects swing highs and lows using configurable pivot strength. When price breaks these levels, it plots:
Settings
Pivot Strength - Number of candles on each side required to confirm a swing high/low (default: 5). Higher values identify more significant pivots but produce fewer signals.
Breakout Confirmation - Choose whether breakouts require a candle close beyond the level ("Close") or just a wick touch ("Wick").
Show BOS / Show ChoCh - Toggle visibility of Break of Structure and Change of Character signals independently.
Colors - Customize the colors for bullish (cyan) and bearish (red) signals.
Perfect for swing traders and market structure analysis.
This indicator identifies key market structure shifts using Break of Structure (BOS) and Change of Character (ChoCh) signals based on pivot point analysis.
Concept
Break of Structure (BOS) occurs when price breaks through a significant pivot level in the direction of the current trend, signaling trend continuation. A bullish BOS happens when price breaks above a pivot high while in an uptrend, while a bearish BOS occurs when price breaks below a pivot low during a downtrend.
Change of Character (ChoCh) signals a potential trend reversal. It occurs when price breaks against the prevailing trend - breaking above a pivot high while in a downtrend, or breaking below a pivot low while in an uptrend. This indicates the market structure is shifting.
How It Works
The indicator automatically detects swing highs and lows using configurable pivot strength. When price breaks these levels, it plots:
- Color-coded labels (cyan for bullish breaks, red for bearish breaks)
- Small horizontal lines marking the exact breakout level
- Extended lines from pivot points showing key support/resistance levels
Settings
Pivot Strength - Number of candles on each side required to confirm a swing high/low (default: 5). Higher values identify more significant pivots but produce fewer signals.
Breakout Confirmation - Choose whether breakouts require a candle close beyond the level ("Close") or just a wick touch ("Wick").
Show BOS / Show ChoCh - Toggle visibility of Break of Structure and Change of Character signals independently.
Colors - Customize the colors for bullish (cyan) and bearish (red) signals.
Perfect for swing traders and market structure analysis.
오픈 소스 스크립트
트레이딩뷰의 진정한 정신에 따라, 이 스크립트의 작성자는 이를 오픈소스로 공개하여 트레이더들이 기능을 검토하고 검증할 수 있도록 했습니다. 작성자에게 찬사를 보냅니다! 이 코드는 무료로 사용할 수 있지만, 코드를 재게시하는 경우 하우스 룰이 적용된다는 점을 기억하세요.
면책사항
해당 정보와 게시물은 금융, 투자, 트레이딩 또는 기타 유형의 조언이나 권장 사항으로 간주되지 않으며, 트레이딩뷰에서 제공하거나 보증하는 것이 아닙니다. 자세한 내용은 이용 약관을 참조하세요.
오픈 소스 스크립트
트레이딩뷰의 진정한 정신에 따라, 이 스크립트의 작성자는 이를 오픈소스로 공개하여 트레이더들이 기능을 검토하고 검증할 수 있도록 했습니다. 작성자에게 찬사를 보냅니다! 이 코드는 무료로 사용할 수 있지만, 코드를 재게시하는 경우 하우스 룰이 적용된다는 점을 기억하세요.
면책사항
해당 정보와 게시물은 금융, 투자, 트레이딩 또는 기타 유형의 조언이나 권장 사항으로 간주되지 않으며, 트레이딩뷰에서 제공하거나 보증하는 것이 아닙니다. 자세한 내용은 이용 약관을 참조하세요.