OPEN-SOURCE SCRIPT
Relative Price Difference [LAVA]
EDIT: Look below for updates to the script.
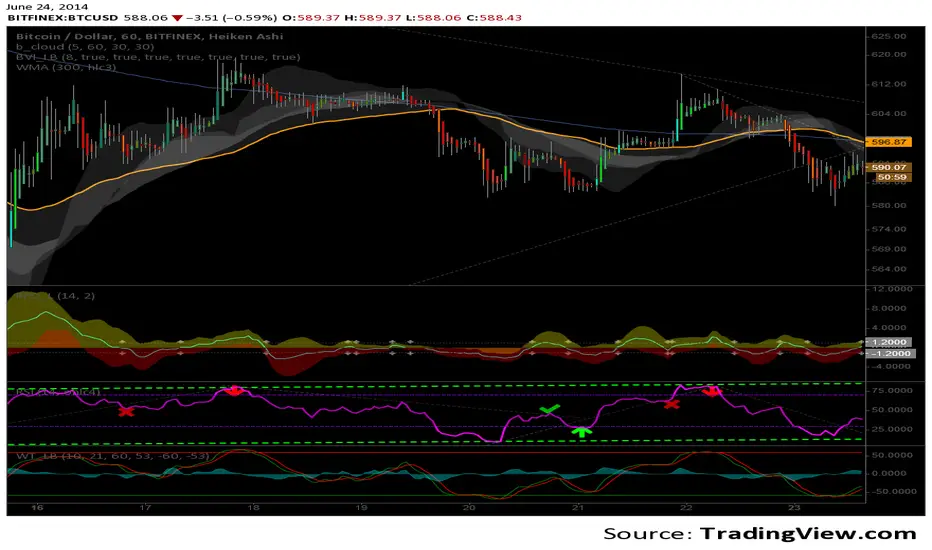
EDIT: After several updates to this script, I think it's safe to say it will work with all timelines. Using hand drawn trendlines, it can predict tops and bottoms with pretty good accuracy.
Shows a change in the relative price difference via percentage on a 0 horizontal. Added a bollinger band to help identify weak areas (orange). If orange starts showing, the current price direction is strong but can reverse harshly. If you are in a weak position, exit here. Otherwise, don't enter a trade after/during orange sessions until a full cycle (up/dn > 1% without orange) has completed. The main line indicator fluctuates according to the price difference. 1% horizontal lines are added to help identify profit taking spots or OTE zones. Ensure the 1% line is crossed completely before you decide to enter/exit. Cross points are identified with crosses if you missed your window, this is the last spot to exit, enter. This indicator doesn't work that well with small time intervals. As always, use more than one indicator to ensure your decision is right. (The colors are ugly so change them if you wish! :)
오픈 소스 스크립트
트레이딩뷰의 진정한 정신에 따라, 이 스크립트의 작성자는 이를 오픈소스로 공개하여 트레이더들이 기능을 검토하고 검증할 수 있도록 했습니다. 작성자에게 찬사를 보냅니다! 이 코드는 무료로 사용할 수 있지만, 코드를 재게시하는 경우 하우스 룰이 적용된다는 점을 기억하세요.
면책사항
해당 정보와 게시물은 금융, 투자, 트레이딩 또는 기타 유형의 조언이나 권장 사항으로 간주되지 않으며, 트레이딩뷰에서 제공하거나 보증하는 것이 아닙니다. 자세한 내용은 이용 약관을 참조하세요.
오픈 소스 스크립트
트레이딩뷰의 진정한 정신에 따라, 이 스크립트의 작성자는 이를 오픈소스로 공개하여 트레이더들이 기능을 검토하고 검증할 수 있도록 했습니다. 작성자에게 찬사를 보냅니다! 이 코드는 무료로 사용할 수 있지만, 코드를 재게시하는 경우 하우스 룰이 적용된다는 점을 기억하세요.
면책사항
해당 정보와 게시물은 금융, 투자, 트레이딩 또는 기타 유형의 조언이나 권장 사항으로 간주되지 않으며, 트레이딩뷰에서 제공하거나 보증하는 것이 아닙니다. 자세한 내용은 이용 약관을 참조하세요.