OPEN-SOURCE SCRIPT
Kawasaki_MFI
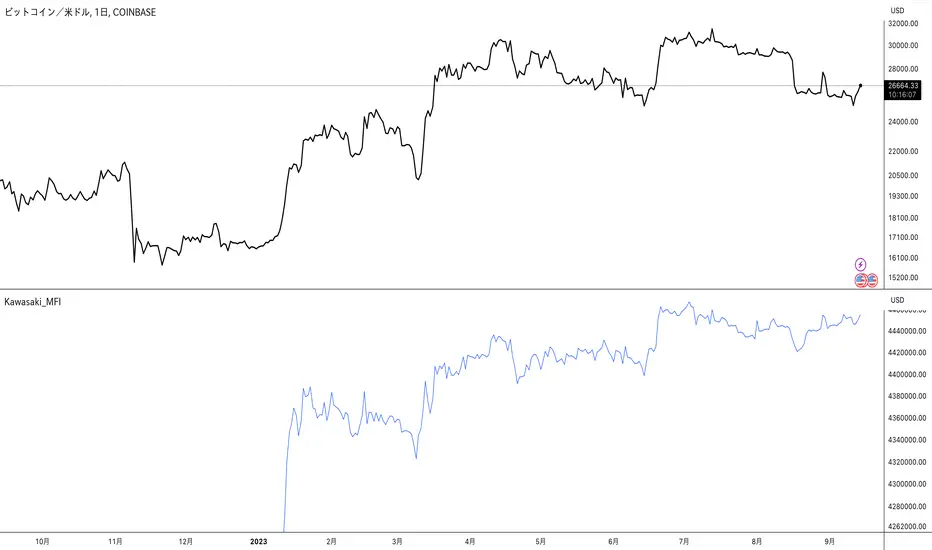
Kawasaki_MFI Indicator
The Kawasaki_MFI indicator is a customized technical analysis tool developed to analyze asset prices in financial markets. This script is implemented in TradingView's Pine Script language (version 5) and is based on the concept of the Accumulation/Distribution Line (ADL) which is a volume-based indicator designed to measure the cumulative flow of money into and out of a security.
Script Details
Version: Pine Script version 5
Overlay: True - The indicator is plotted directly on the price chart.
Input Variables
The script utilizes the following input variables sourced from daily (D) time frames:
High (my_high): The highest price of the security in the daily time frame.
Low (my_low): The lowest price of the security in the daily time frame.
Close (my_close): The closing price of the security in the daily time frame.
Volume (my_volume): The trading volume of the security in the daily time frame.
ADL Calculation
The ADL is calculated using the following formula:
ADL
=
Cumulative sum of ((Close−Low)−(High−Close)High−Low×Volume)
ADL=Cumulative sum of ( High−Low(Close−Low)−(High−Close)×Volume)
Plot
The ADL line is plotted on the chart with the following characteristics:
Title: ADL
Color: Blue
Usage
Traders can use the Kawasaki_MFI indicator to identify trends and potential reversal points in the market. A rising ADL line suggests buying pressure, while a falling ADL line suggests selling pressure. It can be used in conjunction with other technical indicators to develop a comprehensive trading strategy.
Feel free to add more details or modify the description to better suit your needs.
오픈 소스 스크립트
트레이딩뷰의 진정한 정신에 따라, 이 스크립트의 작성자는 이를 오픈소스로 공개하여 트레이더들이 기능을 검토하고 검증할 수 있도록 했습니다. 작성자에게 찬사를 보냅니다! 이 코드는 무료로 사용할 수 있지만, 코드를 재게시하는 경우 하우스 룰이 적용된다는 점을 기억하세요.
면책사항
해당 정보와 게시물은 금융, 투자, 트레이딩 또는 기타 유형의 조언이나 권장 사항으로 간주되지 않으며, 트레이딩뷰에서 제공하거나 보증하는 것이 아닙니다. 자세한 내용은 이용 약관을 참조하세요.
오픈 소스 스크립트
트레이딩뷰의 진정한 정신에 따라, 이 스크립트의 작성자는 이를 오픈소스로 공개하여 트레이더들이 기능을 검토하고 검증할 수 있도록 했습니다. 작성자에게 찬사를 보냅니다! 이 코드는 무료로 사용할 수 있지만, 코드를 재게시하는 경우 하우스 룰이 적용된다는 점을 기억하세요.
면책사항
해당 정보와 게시물은 금융, 투자, 트레이딩 또는 기타 유형의 조언이나 권장 사항으로 간주되지 않으며, 트레이딩뷰에서 제공하거나 보증하는 것이 아닙니다. 자세한 내용은 이용 약관을 참조하세요.