OPEN-SOURCE SCRIPT
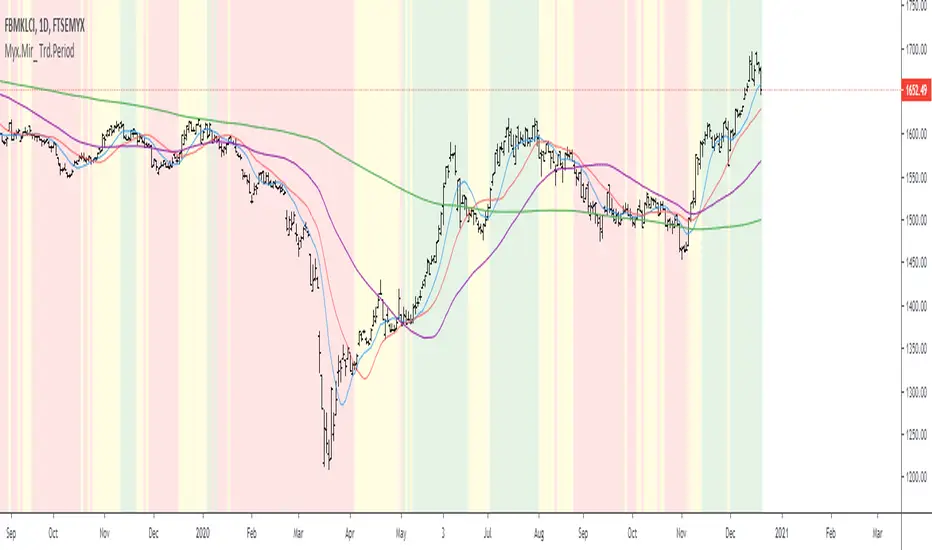
Myx.Mir_ Trd.Period c/w Background Color

Myx.Mir_ Trd.Period c/w Background Color
FBMKLCI is a main Indices/ references
Basis = Based on Simple Moving Average
Note:-
BG= Background Color
Based on personal study:-
BG is Green = Current index > MA 20 > MA 50 = Sign of Bullish // majority portfolio should be in green & make profit... Hehehe
BG is Yellow = MA50 < Current Index < MA 20 = No solid direction and/or sideways // ----------------------------------------------------... should plan to hold or exit
BG is Red = Current Index < MA 50 = Sign of Bearish // majority of portfolio should be in red... Hehehe. Should be run Fast Fast.....
can do your own Trade Record Based on 3 phases [BG Green, Yellow, Red]
a) When the strategy/ Technique are perform better @ more gain and Don't chase the price ... "nanti asal Kejar Pucuks Je price terus Droppp..." Hehe.
b) When the strategy / Technique not perform well...
오픈 소스 스크립트
트레이딩뷰의 진정한 정신에 따라, 이 스크립트의 작성자는 이를 오픈소스로 공개하여 트레이더들이 기능을 검토하고 검증할 수 있도록 했습니다. 작성자에게 찬사를 보냅니다! 이 코드는 무료로 사용할 수 있지만, 코드를 재게시하는 경우 하우스 룰이 적용된다는 점을 기억하세요.
면책사항
해당 정보와 게시물은 금융, 투자, 트레이딩 또는 기타 유형의 조언이나 권장 사항으로 간주되지 않으며, 트레이딩뷰에서 제공하거나 보증하는 것이 아닙니다. 자세한 내용은 이용 약관을 참조하세요.
오픈 소스 스크립트
트레이딩뷰의 진정한 정신에 따라, 이 스크립트의 작성자는 이를 오픈소스로 공개하여 트레이더들이 기능을 검토하고 검증할 수 있도록 했습니다. 작성자에게 찬사를 보냅니다! 이 코드는 무료로 사용할 수 있지만, 코드를 재게시하는 경우 하우스 룰이 적용된다는 점을 기억하세요.
면책사항
해당 정보와 게시물은 금융, 투자, 트레이딩 또는 기타 유형의 조언이나 권장 사항으로 간주되지 않으며, 트레이딩뷰에서 제공하거나 보증하는 것이 아닙니다. 자세한 내용은 이용 약관을 참조하세요.