OPEN-SOURCE SCRIPT
Crypto$ure EMA with 4H Trend Table
The Crypto URE EMA indicator provides a clear, multi-timeframe confirmation setup to help you align your shorter-term trades with the broader market trend.
Key Features:
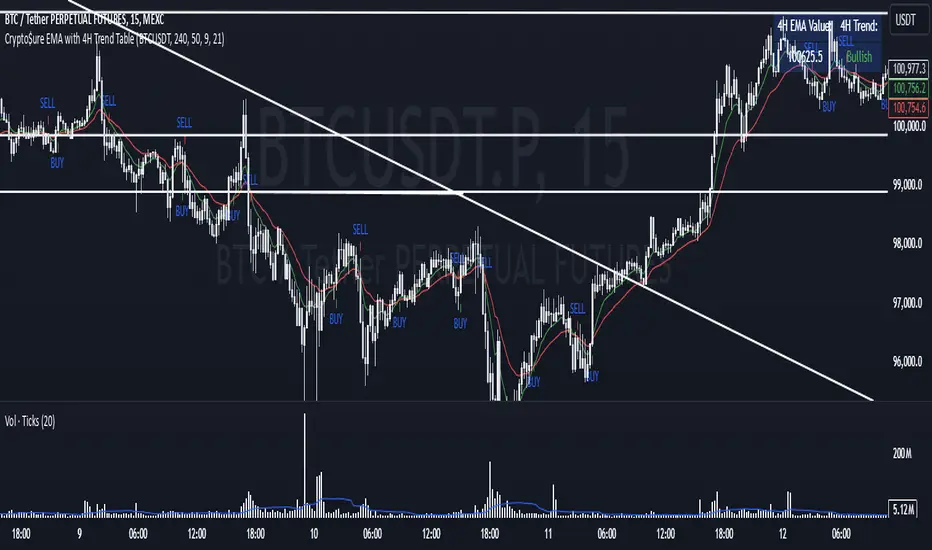
4-Hour EMA Trend Insight:
A table, displayed at the top-right corner of your chart, shows the current 4-hour EMA value and whether the 4-hour trend is Bullish, Bearish, or Neutral. This gives you a reliable, higher-timeframe perspective, making it easier to understand the general market direction.
Lower Timeframe Signals (e.g., 25m or 15m):
On your chosen chart timeframe, the indicator plots two EMAs (Fast and Slow).
A Buy Signal (an up arrow) appears when the Fast EMA crosses above the Slow EMA, indicating potential upward momentum.
A Sell Signal (a down arrow) appears when the Fast EMA crosses below the Slow EMA, indicating potential downward momentum.
Manual Confirmation for Better Accuracy:
While the Buy/Sell signals come directly from the shorter timeframe, you can use the 4-hour trend information from the table to confirm or filter these signals. For example, if the 4-hour trend is Bullish, the Buy signals on the shorter timeframe may carry more weight. If it’s Bearish, then the Sell signals might be more reliable.
How to Use:
Add the CryptoURE EMA indicator to your chart.
Check the top-right table to see the current 4-hour EMA trend.
Watch for Buy (up arrow) or Sell (down arrow) signals on your current timeframe.
For added confidence, consider taking Buy signals only when the 4-hour trend is Bullish and Sell signals when the 4-hour trend is Bearish.
Note:
This indicator does not generate trading orders. Instead, it provides actionable insights to help guide your discretionary decision-making. Always consider additional market context, risk management practices, and personal trading rules before acting on any signal.
Key Features:
4-Hour EMA Trend Insight:
A table, displayed at the top-right corner of your chart, shows the current 4-hour EMA value and whether the 4-hour trend is Bullish, Bearish, or Neutral. This gives you a reliable, higher-timeframe perspective, making it easier to understand the general market direction.
Lower Timeframe Signals (e.g., 25m or 15m):
On your chosen chart timeframe, the indicator plots two EMAs (Fast and Slow).
A Buy Signal (an up arrow) appears when the Fast EMA crosses above the Slow EMA, indicating potential upward momentum.
A Sell Signal (a down arrow) appears when the Fast EMA crosses below the Slow EMA, indicating potential downward momentum.
Manual Confirmation for Better Accuracy:
While the Buy/Sell signals come directly from the shorter timeframe, you can use the 4-hour trend information from the table to confirm or filter these signals. For example, if the 4-hour trend is Bullish, the Buy signals on the shorter timeframe may carry more weight. If it’s Bearish, then the Sell signals might be more reliable.
How to Use:
Add the Crypto
Check the top-right table to see the current 4-hour EMA trend.
Watch for Buy (up arrow) or Sell (down arrow) signals on your current timeframe.
For added confidence, consider taking Buy signals only when the 4-hour trend is Bullish and Sell signals when the 4-hour trend is Bearish.
Note:
This indicator does not generate trading orders. Instead, it provides actionable insights to help guide your discretionary decision-making. Always consider additional market context, risk management practices, and personal trading rules before acting on any signal.
오픈 소스 스크립트
트레이딩뷰의 진정한 정신에 따라, 이 스크립트의 작성자는 이를 오픈소스로 공개하여 트레이더들이 기능을 검토하고 검증할 수 있도록 했습니다. 작성자에게 찬사를 보냅니다! 이 코드는 무료로 사용할 수 있지만, 코드를 재게시하는 경우 하우스 룰이 적용된다는 점을 기억하세요.
면책사항
해당 정보와 게시물은 금융, 투자, 트레이딩 또는 기타 유형의 조언이나 권장 사항으로 간주되지 않으며, 트레이딩뷰에서 제공하거나 보증하는 것이 아닙니다. 자세한 내용은 이용 약관을 참조하세요.
오픈 소스 스크립트
트레이딩뷰의 진정한 정신에 따라, 이 스크립트의 작성자는 이를 오픈소스로 공개하여 트레이더들이 기능을 검토하고 검증할 수 있도록 했습니다. 작성자에게 찬사를 보냅니다! 이 코드는 무료로 사용할 수 있지만, 코드를 재게시하는 경우 하우스 룰이 적용된다는 점을 기억하세요.
면책사항
해당 정보와 게시물은 금융, 투자, 트레이딩 또는 기타 유형의 조언이나 권장 사항으로 간주되지 않으며, 트레이딩뷰에서 제공하거나 보증하는 것이 아닙니다. 자세한 내용은 이용 약관을 참조하세요.