PROTECTED SOURCE SCRIPT
CPD Approach Algo [ValiantTrader]
CPD Approach Algo Indicator Explained
This indicator, created by ValiantTrader, is a sophisticated tool for analyzing price action and market structure across different timeframes. Here's how it works and how traders use it:
Core Functionality
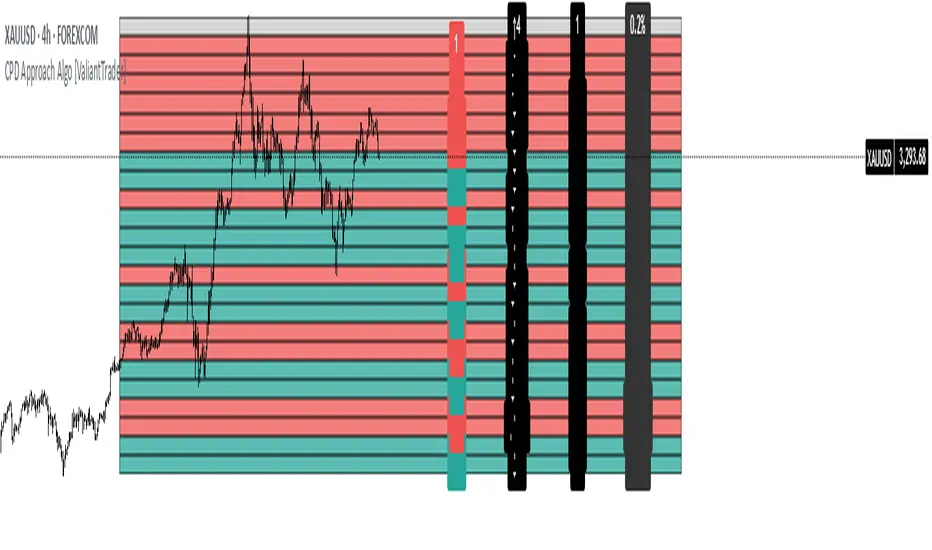
The CPD (Candle Price Distribution) Approach Algo divides the price range into horizontal zones and analyzes several key metrics within each zone:
Price Distribution: Shows where price has spent most time (high concentration areas)
Volume Clusters: Identifies zones with significant trading volume
Pressure Zones: Detects buying/selling pressure in specific price levels
Candle Differences: Highlights transitions between zones
How Traders Use It
1. Identifying Key Levels
The colored zones (green for buy, red for sell, gray neutral) show where price has historically reacted
Dense candle clusters indicate strong support/resistance areas
2. Volume Analysis
Volume clusters reveal where most trading activity occurred
High volume zones often act as magnets for price or reversal points
3. Pressure Detection
The pressure zones (with ↑ and ↓ arrows) show where buying or selling pressure was strongest
Helps identify potential breakout or reversal points
4. Multi-Timeframe Analysis
The custom timeframe input allows analyzing higher timeframe structure while viewing lower timeframe charts
Helps align trades with the dominant timeframe's structure
5. Transition Analysis
The delta values between zones show how price is moving between levels
Positive deltas (green) show upward momentum, negative (red) show downward
Practical Trading Applications
Support/Resistance Trading: Fade price at dense candle clusters with opposing pressure
Breakout Trading: Trade breaks from low-candle-count zones into high-volume zones
Mean Reversion: Trade returns to high-volume value areas after deviations
Trend Confirmation: Consistent pressure in one direction confirms trend strength
The indicator provides a comprehensive view of market structure by combining price, volume, and time elements across customizable timeframes, helping traders make more informed decisions about potential entries, exits, and key levels to watch.
This indicator, created by ValiantTrader, is a sophisticated tool for analyzing price action and market structure across different timeframes. Here's how it works and how traders use it:
Core Functionality
The CPD (Candle Price Distribution) Approach Algo divides the price range into horizontal zones and analyzes several key metrics within each zone:
Price Distribution: Shows where price has spent most time (high concentration areas)
Volume Clusters: Identifies zones with significant trading volume
Pressure Zones: Detects buying/selling pressure in specific price levels
Candle Differences: Highlights transitions between zones
How Traders Use It
1. Identifying Key Levels
The colored zones (green for buy, red for sell, gray neutral) show where price has historically reacted
Dense candle clusters indicate strong support/resistance areas
2. Volume Analysis
Volume clusters reveal where most trading activity occurred
High volume zones often act as magnets for price or reversal points
3. Pressure Detection
The pressure zones (with ↑ and ↓ arrows) show where buying or selling pressure was strongest
Helps identify potential breakout or reversal points
4. Multi-Timeframe Analysis
The custom timeframe input allows analyzing higher timeframe structure while viewing lower timeframe charts
Helps align trades with the dominant timeframe's structure
5. Transition Analysis
The delta values between zones show how price is moving between levels
Positive deltas (green) show upward momentum, negative (red) show downward
Practical Trading Applications
Support/Resistance Trading: Fade price at dense candle clusters with opposing pressure
Breakout Trading: Trade breaks from low-candle-count zones into high-volume zones
Mean Reversion: Trade returns to high-volume value areas after deviations
Trend Confirmation: Consistent pressure in one direction confirms trend strength
The indicator provides a comprehensive view of market structure by combining price, volume, and time elements across customizable timeframes, helping traders make more informed decisions about potential entries, exits, and key levels to watch.
보호된 스크립트입니다
이 스크립트는 비공개 소스로 게시됩니다. 하지만 이를 자유롭게 제한 없이 사용할 수 있습니다 – 자세한 내용은 여기에서 확인하세요.
면책사항
해당 정보와 게시물은 금융, 투자, 트레이딩 또는 기타 유형의 조언이나 권장 사항으로 간주되지 않으며, 트레이딩뷰에서 제공하거나 보증하는 것이 아닙니다. 자세한 내용은 이용 약관을 참조하세요.
보호된 스크립트입니다
이 스크립트는 비공개 소스로 게시됩니다. 하지만 이를 자유롭게 제한 없이 사용할 수 있습니다 – 자세한 내용은 여기에서 확인하세요.
면책사항
해당 정보와 게시물은 금융, 투자, 트레이딩 또는 기타 유형의 조언이나 권장 사항으로 간주되지 않으며, 트레이딩뷰에서 제공하거나 보증하는 것이 아닙니다. 자세한 내용은 이용 약관을 참조하세요.