OPEN-SOURCE SCRIPT
업데이트됨 Reverse Moving Average Convergence Divergence [CC]
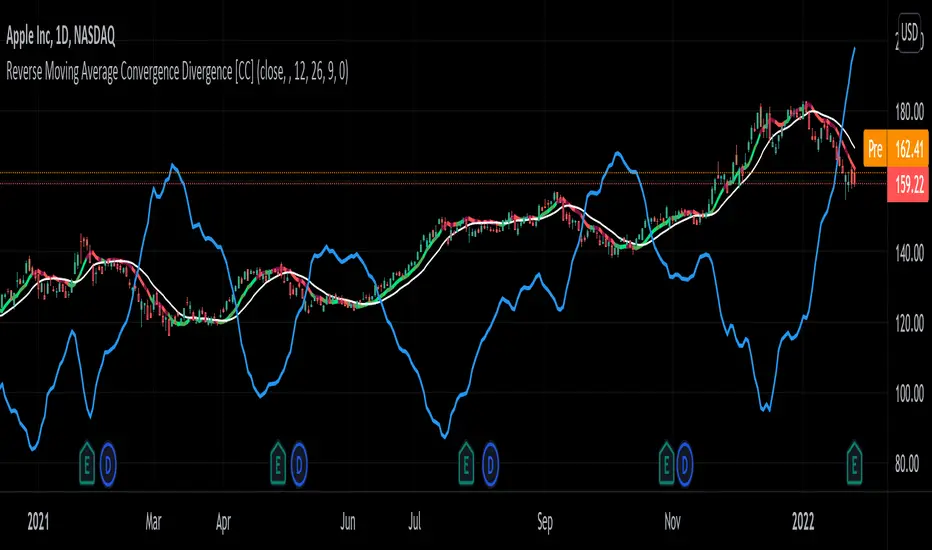
The Reverse Macd was created by Johnny Dough (Stocks and Commodities Jan 2012) and this is another indicator in my ongoing series to find those hidden gems. This indicator works in a few very powerful ways. For example the blue line shows you what the current price would be if the macd was at the macd level that you choose. I set the default to 0 but feel free to change it if you want. This will give you short to medium term info by telling you if it is an uptrend when the price is above the blue line or vice versa. It also creates the reverse macd line and it's signal line by using information from the previous day to decompile the macd and show you the price that it would be at if the macd was at that level. It turns this into a new moving average that closely tracks price movements and with the two competing signals, gives you more than enough info to find the perfect entry and exit points. Like always I have included strong buy and sell signals in addition to normal ones so darker colors are strong signals and lighter colors are normal signals. Buy when the line is green and sell when it is red.
Let me know if there are any other scripts you would like to see me publish!
Let me know if there are any other scripts you would like to see me publish!
릴리즈 노트
Included a fix for forex symbols not working correctly with this indicator오픈 소스 스크립트
트레이딩뷰의 진정한 정신에 따라, 이 스크립트의 작성자는 이를 오픈소스로 공개하여 트레이더들이 기능을 검토하고 검증할 수 있도록 했습니다. 작성자에게 찬사를 보냅니다! 이 코드는 무료로 사용할 수 있지만, 코드를 재게시하는 경우 하우스 룰이 적용된다는 점을 기억하세요.
면책사항
해당 정보와 게시물은 금융, 투자, 트레이딩 또는 기타 유형의 조언이나 권장 사항으로 간주되지 않으며, 트레이딩뷰에서 제공하거나 보증하는 것이 아닙니다. 자세한 내용은 이용 약관을 참조하세요.
오픈 소스 스크립트
트레이딩뷰의 진정한 정신에 따라, 이 스크립트의 작성자는 이를 오픈소스로 공개하여 트레이더들이 기능을 검토하고 검증할 수 있도록 했습니다. 작성자에게 찬사를 보냅니다! 이 코드는 무료로 사용할 수 있지만, 코드를 재게시하는 경우 하우스 룰이 적용된다는 점을 기억하세요.
면책사항
해당 정보와 게시물은 금융, 투자, 트레이딩 또는 기타 유형의 조언이나 권장 사항으로 간주되지 않으며, 트레이딩뷰에서 제공하거나 보증하는 것이 아닙니다. 자세한 내용은 이용 약관을 참조하세요.