INVITE-ONLY SCRIPT
업데이트됨 Multi-Timeframe Trend Analysis [LevelUp]
Multi-Timeframe Trend Analysis was created through a collaborative effort with David Ryan, three-time winner of the U.S. Investing Championship. In addition to working with William O'Neil, founder of Investor's Business Daily, David managed the New USA Growth Fund at William O’Neil + Company.
Identifying Trends and Box Types
It's easy to get caught up with the noise of tracking price movement, bar by bar. This is even more relevant on lower timeframes. When performing trend analysis, it can be very helpful to step back and look at the bigger picture.
To help facilitate visualizing trends, with this indicator you can view higher timeframe data without changing to a new chart:
■ View the weekly trend from a daily chart.
■ View the monthly trend from a weekly chart.
■ View the quarterly trend from a monthly chart.
The weekly chart of GOOGL is shown below. Each box encapsulates one month of trading activity. You can also see the four types of boxes that may be shown: up, down, inside and outside.

Up Box - When a box highest high is above the previous box high, it is considered an up box. The percent change shows the increase from the previous box highest high to the highest high of the current box.
Down Box - When a box lowest low is below the previous box lowest low, it is considered a down box. The percent change shows the decrease from the previous box lowest low to the lowest low of the current box.
Inside Box - When a box highest high is below the previous box highest high, and the box lowest low is greater than the previous box lowest low, it is considered an inside box. Two percent changes are shown. One indicating the decrease from previous box highest high to the highest high of the current box. The other indicating the increase from the previous box lowest low to the lowest low of the current box.
Outside Box - When a box highest high is above the previous box highest high, and the box lowest low is below the previous box lowest low, it is considered an outside box. Two percent changes are shown. One indicating the increase from previous box highest high to the highest high of the current box. The other indicating the decrease from the previous box lowest low to the lowest low of the current box.
Special Note for Outside Boxes: As far as outside boxes and whether they are continuing or changing the trend, it depends on the action of the most recent high or low. The box is considered to be an up box if the highest high is more recent than the lowest low, and vice versa.
How to Use the Indicator
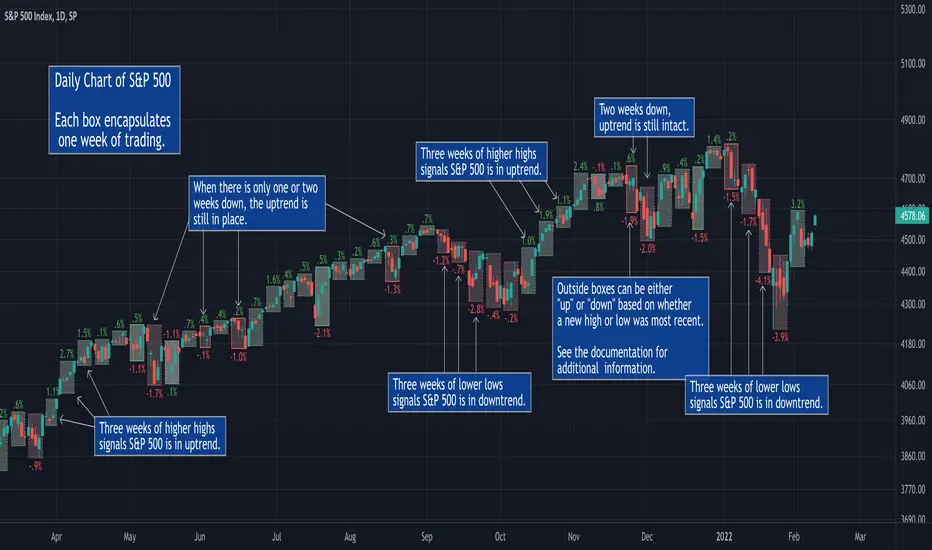
The goal of this indicator is to help spot changes in the trend. Historical price data has shown that movements up/down often occur in threes. By looking for boxes encapsulating higher timeframe moves, we can see when a trend may be changing.
Three Higher Highs - If price movement is sideways or down and is followed by three consecutive higher highs, this may be the start of an uptrend.
Three Lower Lows - If price movement is sideways or up and is followed by three consecutive lower lows, this may be the start of a downtrend.

Percent Change Information
Each box has an optional percent (%) change value. Refer to the image and description below for more information.

Additional Examples


Features
■ View price action trends of higher timeframes without changing the chart timeframe.
■ View percent gain/loss from one box to another.
■ Customize box border and background colors.
■ Show/hide percent change values.
Identifying Trends and Box Types
It's easy to get caught up with the noise of tracking price movement, bar by bar. This is even more relevant on lower timeframes. When performing trend analysis, it can be very helpful to step back and look at the bigger picture.
To help facilitate visualizing trends, with this indicator you can view higher timeframe data without changing to a new chart:
■ View the weekly trend from a daily chart.
■ View the monthly trend from a weekly chart.
■ View the quarterly trend from a monthly chart.
The weekly chart of GOOGL is shown below. Each box encapsulates one month of trading activity. You can also see the four types of boxes that may be shown: up, down, inside and outside.
Up Box - When a box highest high is above the previous box high, it is considered an up box. The percent change shows the increase from the previous box highest high to the highest high of the current box.
Down Box - When a box lowest low is below the previous box lowest low, it is considered a down box. The percent change shows the decrease from the previous box lowest low to the lowest low of the current box.
Inside Box - When a box highest high is below the previous box highest high, and the box lowest low is greater than the previous box lowest low, it is considered an inside box. Two percent changes are shown. One indicating the decrease from previous box highest high to the highest high of the current box. The other indicating the increase from the previous box lowest low to the lowest low of the current box.
Outside Box - When a box highest high is above the previous box highest high, and the box lowest low is below the previous box lowest low, it is considered an outside box. Two percent changes are shown. One indicating the increase from previous box highest high to the highest high of the current box. The other indicating the decrease from the previous box lowest low to the lowest low of the current box.
Special Note for Outside Boxes: As far as outside boxes and whether they are continuing or changing the trend, it depends on the action of the most recent high or low. The box is considered to be an up box if the highest high is more recent than the lowest low, and vice versa.
How to Use the Indicator
The goal of this indicator is to help spot changes in the trend. Historical price data has shown that movements up/down often occur in threes. By looking for boxes encapsulating higher timeframe moves, we can see when a trend may be changing.
Three Higher Highs - If price movement is sideways or down and is followed by three consecutive higher highs, this may be the start of an uptrend.
Three Lower Lows - If price movement is sideways or up and is followed by three consecutive lower lows, this may be the start of a downtrend.
Percent Change Information
Each box has an optional percent (%) change value. Refer to the image and description below for more information.
Additional Examples
Features
■ View price action trends of higher timeframes without changing the chart timeframe.
■ View percent gain/loss from one box to another.
■ Customize box border and background colors.
■ Show/hide percent change values.
릴리즈 노트
Version 2.0■ Add support for Futures and Forex.
릴리즈 노트
Version 3.0■ Minor updates to Settings.
초대 전용 스크립트
이 스크립트는 작성자가 승인한 사용자만 접근할 수 있습니다. 사용하려면 요청 후 승인을 받아야 하며, 일반적으로 결제 후에 허가가 부여됩니다. 자세한 내용은 아래 작성자의 안내를 따르거나 LevelUpTools에게 직접 문의하세요.
트레이딩뷰는 스크립트의 작동 방식을 충분히 이해하고 작성자를 완전히 신뢰하지 않는 이상, 해당 스크립트에 비용을 지불하거나 사용하는 것을 권장하지 않습니다. 커뮤니티 스크립트에서 무료 오픈소스 대안을 찾아보실 수도 있습니다.
작성자 지시 사항
Purchase the Multi-Timeframe Trend Analysis indicator as part of the Power Trend Pro Toolkit: https://PowerTrendPro.com
Join traders in over 40 countries and LevelUp!
tradingview.com/spaces/LevelUpTools/
tradingview.com/spaces/LevelUpTools/
면책사항
해당 정보와 게시물은 금융, 투자, 트레이딩 또는 기타 유형의 조언이나 권장 사항으로 간주되지 않으며, 트레이딩뷰에서 제공하거나 보증하는 것이 아닙니다. 자세한 내용은 이용 약관을 참조하세요.