INVITE-ONLY SCRIPT
업데이트됨 SeikaAlgo–Long/Short Buy/Sell Signal
SeikaAlgo–Long/Short Buy/Sell Signal — Simple, Visual, Reliable Signals
SeikaAlgo makes high-probability trading simple and actionable for everyone—no complex rules, no guesswork. Just follow these 3 steps:
How It Works
1. Watch for Buy/Sell Signals
Buy and Sell signals are printed right on your chart, only after the candle closes—never repaints, never lags. Trade with confidence.
2. Enter at Candle Close
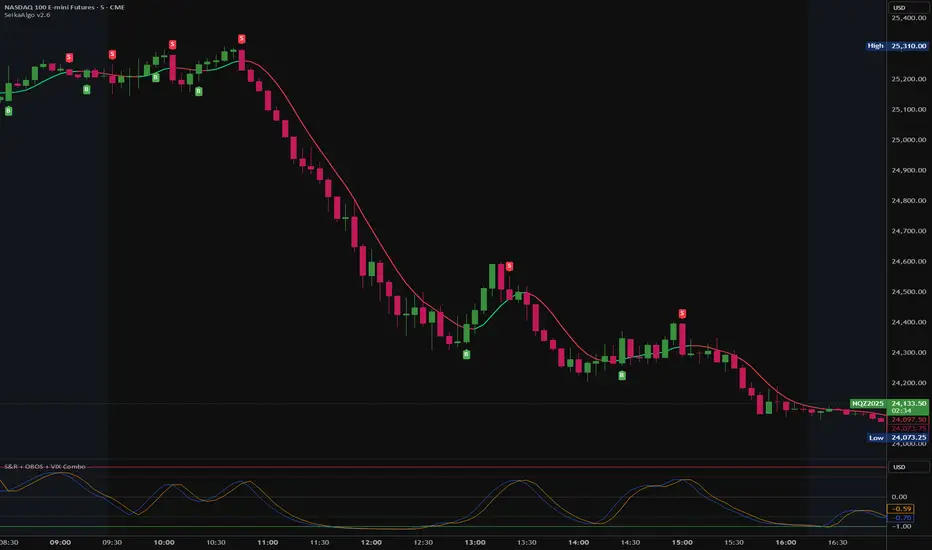
Buy: Enter at the close of a candle when a green “B” label appears and price crosses above the green EMA 9.
Sell: Enter at the close of a candle when a red “S” label appears and price crosses below the red EMA 9.
3. Take Profit
Move your stop loss with each new candle (trailing stop), or use the EMA 9 line to trail stops.
Take profit when price reaches a Daily Fibonacci Level.
Example — 5min SPY
Buy Signal: Green label prints above green EMA 9 after candle closes. Enter at close, stop just below the signal candle’s low.
Sell Signal: Red label prints below red EMA 9 after candle closes. Enter at close, stop just above the signal candle’s high.
Key Features
No Lag, No Repainting: Signals only appear after a candle is complete—so you’re never chasing ghosts.
Clear Visual Cues: Instantly know when to buy, sell, or step aside.
Built-in Trailing Stop Logic: Protect your trades easily.
Works On Any Market/Timeframe: Perfect for stocks, futures, crypto, or forex.
SeikaAlgo is an invite-only indicator.
Add it to your chart, follow the labels and EMA, and trade with confidence—no clutter, no confusion. Simple, visual, reliable.
SeikaAlgo makes high-probability trading simple and actionable for everyone—no complex rules, no guesswork. Just follow these 3 steps:
How It Works
1. Watch for Buy/Sell Signals
Buy and Sell signals are printed right on your chart, only after the candle closes—never repaints, never lags. Trade with confidence.
2. Enter at Candle Close
Buy: Enter at the close of a candle when a green “B” label appears and price crosses above the green EMA 9.
Sell: Enter at the close of a candle when a red “S” label appears and price crosses below the red EMA 9.
3. Take Profit
Move your stop loss with each new candle (trailing stop), or use the EMA 9 line to trail stops.
Take profit when price reaches a Daily Fibonacci Level.
Example — 5min SPY
Buy Signal: Green label prints above green EMA 9 after candle closes. Enter at close, stop just below the signal candle’s low.
Sell Signal: Red label prints below red EMA 9 after candle closes. Enter at close, stop just above the signal candle’s high.
Key Features
No Lag, No Repainting: Signals only appear after a candle is complete—so you’re never chasing ghosts.
Clear Visual Cues: Instantly know when to buy, sell, or step aside.
Built-in Trailing Stop Logic: Protect your trades easily.
Works On Any Market/Timeframe: Perfect for stocks, futures, crypto, or forex.
SeikaAlgo is an invite-only indicator.
Add it to your chart, follow the labels and EMA, and trade with confidence—no clutter, no confusion. Simple, visual, reliable.
릴리즈 노트
SeikaAlgo — Long/Short Buy/Sell SignalsSimple. Visual. Reliable.
Make high-probability trading actionable—no complex rules, no guesswork. Just follow the signal and manage the trade.
How It Works
“B” (Buy) and “S” (Sell) labels print on the chart only after the candle closes—confirmed, no repainting.
*Buy: Enter at the close when a green “B” appears and price crosses above the trend line.
*Sell: Enter at the close when a red “S” appears and price crosses below the trend line.
Trail the position bar-by-bar or along the trend line, then take profit according to your plan.
Dial it in with Signal Filtering Options to hide low-quality setups and match your style.
Level it up: Pair SeikaAlgo with Auto Support & Resistance, Daily Fibonacci Levels, and Overbought & Oversold Zones to stack confluence and boost probability.
Key Features
- Clear Buy & Sell Labels – Straightforward entries right on your chart.
- Trend Line Confirmation – Above the green line favors longs; below the red line favors shorts.
- Visual & Stress-Free – Minimal settings, clean chart, confident decisions.
- Any Market, Any Timeframe – Stocks, crypto, options, futures; from 1-minute to daily and beyond.
- No Lag. No Repaint. – Signals confirm at close and are generated in real time as candles form.
- Auto Support & Resistance (Add-On) – Automatically marks key zones and tags how many times price reacted there—bigger counts = stronger levels.
릴리즈 노트
Strong signal filter logic update릴리즈 노트
Update릴리즈 노트
- Added market session filters.
- Added custom time block filter.
- Added neutral OB/OS filter to Strong Signal.
초대 전용 스크립트
이 스크립트는 작성자가 승인한 사용자만 접근할 수 있습니다. 사용하려면 요청 후 승인을 받아야 하며, 일반적으로 결제 후에 허가가 부여됩니다. 자세한 내용은 아래 작성자의 안내를 따르거나 Asa666에게 직접 문의하세요.
트레이딩뷰는 스크립트의 작동 방식을 충분히 이해하고 작성자를 완전히 신뢰하지 않는 이상, 해당 스크립트에 비용을 지불하거나 사용하는 것을 권장하지 않습니다. 커뮤니티 스크립트에서 무료 오픈소스 대안을 찾아보실 수도 있습니다.
작성자 지시 사항
면책사항
해당 정보와 게시물은 금융, 투자, 트레이딩 또는 기타 유형의 조언이나 권장 사항으로 간주되지 않으며, 트레이딩뷰에서 제공하거나 보증하는 것이 아닙니다. 자세한 내용은 이용 약관을 참조하세요.