OPEN-SOURCE SCRIPT
업데이트됨 🟥 Synthetic 10Y Real Yield (US10Y - Breakeven)
This script calculates and plots a synthetic U.S. 10-Year Real Yield by subtracting the 10-Year Breakeven Inflation Rate (USGGBE10) from the nominal 10-Year Treasury Yield (US10Y).
Real yields are a core macro driver for gold, crypto, growth stocks, and bond pricing, and are closely monitored by institutional traders.
The script includes key reference lines:
0% = Below zero = deeply accommodative regime
1.5% = Common threshold used by macro desks to evaluate gold upside breakout conditions
📈 Use this to monitor macro shifts in real-time and front-run capital flows during major CPI, NFP, and Fed events.
Update Frequency: Daily (based on Treasury market data)
릴리즈 노트
This script calculates and plots a synthetic U.S. 10-Year Real Yield by subtracting the 10-Year Breakeven Inflation Rate (USGGBE10) from the nominal 10-Year Treasury Yield (US10Y).Real yields are a core macro driver for gold, crypto, growth stocks, and bond pricing, and are closely monitored by institutional traders.
The script includes key reference lines:
0% = Below zero = deeply accommodative regime
1.5% = Common threshold used by macro desks to evaluate gold upside breakout conditions
📈 Use this to monitor macro shifts in real-time and front-run capital flows during major CPI, NFP, and Fed events.
Update Frequency: Daily (based on Treasury market data
릴리즈 노트
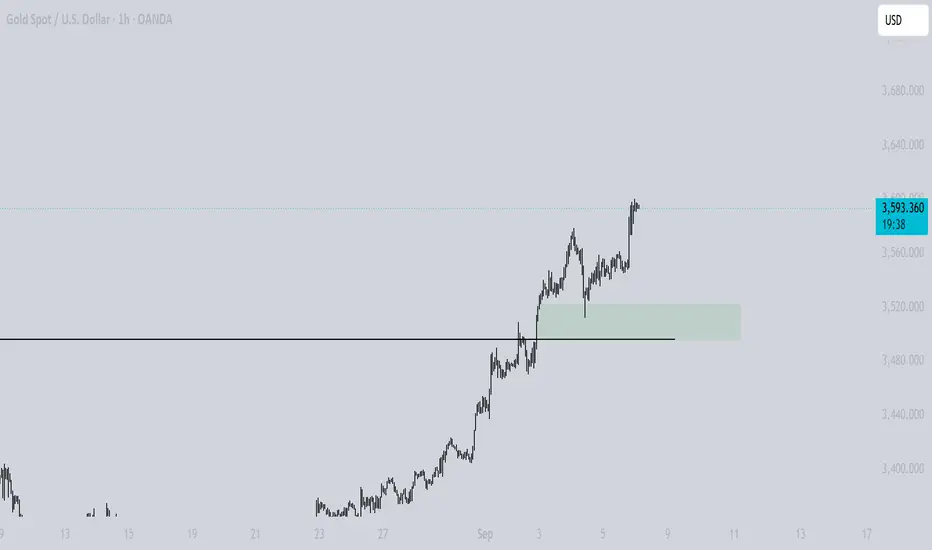
Real Yield Overlay (Gold-Scaled View)Author: [Saraicy]
This script overlays the U.S. 10-Year Real Yield directly onto your price chart (e.g. Gold), scaled and aligned to current price levels for intuitive macro correlation tracking.
📈 How it works:
Real Yield Calculation = Nominal 10Y Treasury Yield (FRED:GS10) − 10Y Breakeven Inflation Rate (FRED:T10YIE)
The result is scaled using a custom slope to reflect 0.1% real yield ≈ 200 price units (adjustable).
Overlay is anchored to a reference real yield and price (e.g. 1.6% at 3400), making real yield fluctuations visually interpretable alongside gold price movement.
A dynamic label shows current real yield (%) on the main chart, aligned with price action.
🔍 Use case:
This tool is designed for macro-informed traders, especially gold, Bitcoin, and rates traders, to:
Track inverse correlation between real yields and gold
Visualize monetary policy shifts and bond market reactions in price space
Aid real-time narrative building around inflation, recession risk, and Fed cuts
⚙️ Customizable inputs (in code):
anchor_yield: The real yield to anchor scaling to
anchor_price: The chart price to align with anchor yield
slope: Determines how dramatically real yield changes appear (default: 0.1% = 200pts)
릴리즈 노트
### **Real Yield Overlay (Gold-Scaled View)****Author:** [Saraicy]
This script overlays the **U.S. 10-Year Real Yield** directly onto your price chart (e.g. Gold), scaled and aligned to current price levels for intuitive macro correlation tracking.
---
### 📈 **How it works:**
- **Real Yield Calculation** = Nominal 10Y Treasury Yield (FRED:GS10) − 10Y Breakeven Inflation Rate (FRED:T10YIE)
- The result is **scaled** using a custom slope to reflect **0.1% real yield ≈ 200 price units** (adjustable).
- Overlay is anchored to a **reference real yield** and **price** (e.g. 1.6% at 3400), making real yield fluctuations visually interpretable alongside gold price movement.
- A **dynamic label** shows current real yield (%) on the main chart, aligned with price action.
---
### 🔍 **Use case:**
This tool is designed for **macro-informed traders**, especially gold, Bitcoin, and rates traders, to:
- Track **inverse correlation** between real yields and gold
- Visualize **monetary policy shifts** and bond market reactions in price space
- Aid real-time narrative building around inflation, recession risk, and Fed cuts
---
### ⚙️ **Customizable inputs (in code):**
- `anchor_yield`: The real yield to anchor scaling to
- `anchor_price`: The chart price to align with anchor yield
- `slope`: Determines how dramatically real yield changes appear (default: 0.1% = 200pts)
오픈 소스 스크립트
트레이딩뷰의 진정한 정신에 따라, 이 스크립트의 작성자는 이를 오픈소스로 공개하여 트레이더들이 기능을 검토하고 검증할 수 있도록 했습니다. 작성자에게 찬사를 보냅니다! 이 코드는 무료로 사용할 수 있지만, 코드를 재게시하는 경우 하우스 룰이 적용된다는 점을 기억하세요.
면책사항
해당 정보와 게시물은 금융, 투자, 트레이딩 또는 기타 유형의 조언이나 권장 사항으로 간주되지 않으며, 트레이딩뷰에서 제공하거나 보증하는 것이 아닙니다. 자세한 내용은 이용 약관을 참조하세요.
오픈 소스 스크립트
트레이딩뷰의 진정한 정신에 따라, 이 스크립트의 작성자는 이를 오픈소스로 공개하여 트레이더들이 기능을 검토하고 검증할 수 있도록 했습니다. 작성자에게 찬사를 보냅니다! 이 코드는 무료로 사용할 수 있지만, 코드를 재게시하는 경우 하우스 룰이 적용된다는 점을 기억하세요.
면책사항
해당 정보와 게시물은 금융, 투자, 트레이딩 또는 기타 유형의 조언이나 권장 사항으로 간주되지 않으며, 트레이딩뷰에서 제공하거나 보증하는 것이 아닙니다. 자세한 내용은 이용 약관을 참조하세요.