OPEN-SOURCE SCRIPT
Bull Bear Bars
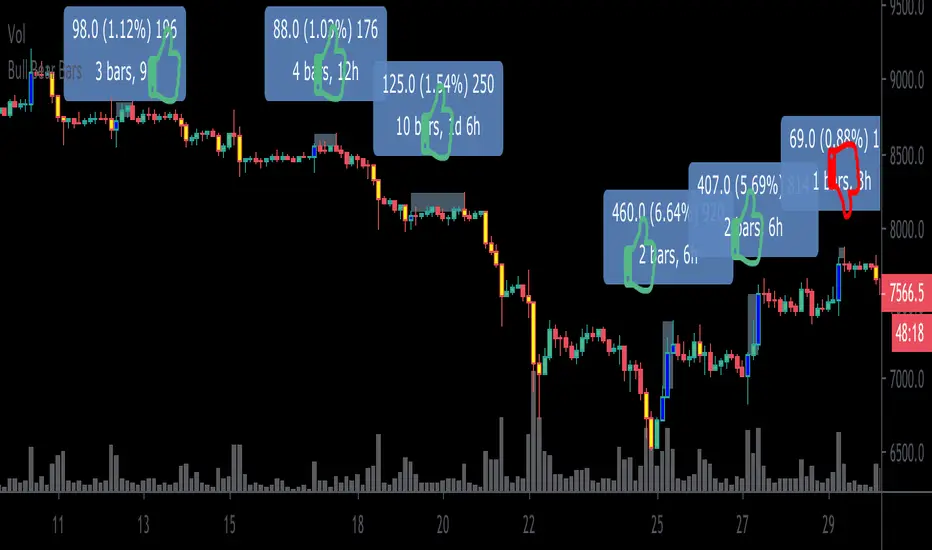
Highlights when the movement of a candle is supported by a major increase in volume. Thus one could reasonably assume that a follow thru is likely to occur.
Blue= bullish
Yellow = bearish
I personally use this as an entry system. I enter only if the blue high or yellow low is surpassed by the very next candle , if not, then i do not enter. Thus trading with momentum and greatly avoiding choppy market conditions.
***Example*** In the chart above, during XBT’s month long November 2019 Downtrend.. I am showing my bull long entries (without showing the obvious winning bear entries!) and found that only once did the price fail to advance less than 1% before any significant drawdown occurs (As shown on the chart by thumbs up & thumbs down symbols.)
***When using this indicator it is important to keep in mind that Blue bullish bars can and will appear at the top of upswings likewise, yellow bearish bars can and will appear at the bottom of downswings.. which could potentially signify trend reversals.
This knowledge can also can be used to ones advantage (” buy when everyone is selling, sell when everyone is buying.”)
This is a common occurrence because retail traders are often late to the party before they catch on to a trend resulting in buying heavily at the top and selling heavily at the bottom providing liquidity to earlier entrants to exit and as per usual the price then reverses on the mass of late bloomers.***
This indicator can be used in many different ways so goodluck in finding the method that best suits your style and be careful out there. Cheers
BONUS: Also has the ability to set alerts!
Blue= bullish
Yellow = bearish
I personally use this as an entry system. I enter only if the blue high or yellow low is surpassed by the very next candle , if not, then i do not enter. Thus trading with momentum and greatly avoiding choppy market conditions.
***Example*** In the chart above, during
***When using this indicator it is important to keep in mind that Blue bullish bars can and will appear at the top of upswings likewise, yellow bearish bars can and will appear at the bottom of downswings.. which could potentially signify trend reversals.
This knowledge can also can be used to ones advantage (” buy when everyone is selling, sell when everyone is buying.”)
This is a common occurrence because retail traders are often late to the party before they catch on to a trend resulting in buying heavily at the top and selling heavily at the bottom providing liquidity to earlier entrants to exit and as per usual the price then reverses on the mass of late bloomers.***
This indicator can be used in many different ways so goodluck in finding the method that best suits your style and be careful out there. Cheers
BONUS: Also has the ability to set alerts!
오픈 소스 스크립트
트레이딩뷰의 진정한 정신에 따라, 이 스크립트의 작성자는 이를 오픈소스로 공개하여 트레이더들이 기능을 검토하고 검증할 수 있도록 했습니다. 작성자에게 찬사를 보냅니다! 이 코드는 무료로 사용할 수 있지만, 코드를 재게시하는 경우 하우스 룰이 적용된다는 점을 기억하세요.
면책사항
해당 정보와 게시물은 금융, 투자, 트레이딩 또는 기타 유형의 조언이나 권장 사항으로 간주되지 않으며, 트레이딩뷰에서 제공하거나 보증하는 것이 아닙니다. 자세한 내용은 이용 약관을 참조하세요.
오픈 소스 스크립트
트레이딩뷰의 진정한 정신에 따라, 이 스크립트의 작성자는 이를 오픈소스로 공개하여 트레이더들이 기능을 검토하고 검증할 수 있도록 했습니다. 작성자에게 찬사를 보냅니다! 이 코드는 무료로 사용할 수 있지만, 코드를 재게시하는 경우 하우스 룰이 적용된다는 점을 기억하세요.
면책사항
해당 정보와 게시물은 금융, 투자, 트레이딩 또는 기타 유형의 조언이나 권장 사항으로 간주되지 않으며, 트레이딩뷰에서 제공하거나 보증하는 것이 아닙니다. 자세한 내용은 이용 약관을 참조하세요.