OPEN-SOURCE SCRIPT
Thirdeyechart Gold – Masterclass Final
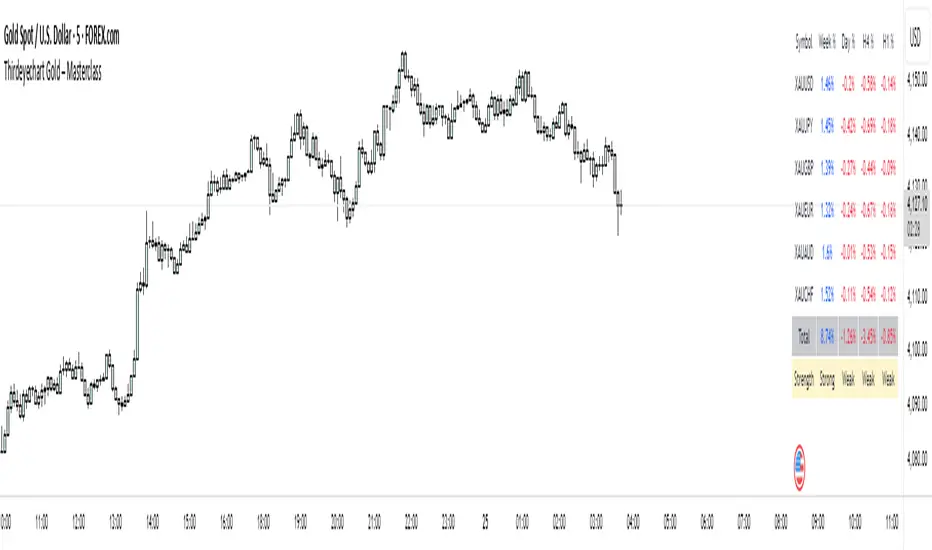
The XAU Masterclass — Final Fix is the definitive TradingView indicator for serious gold traders. Built for speed and clarity, this edition combines a solid boxed layout with an advanced math logic core to detect trend strength quickly across multiple timeframes. Designed specifically for XAU and XAU-related pairs, the indicator shows percentage change on Weekly (W), Daily (D), 4H (H4), and 1H (H1), and distills those readings into a single Total Average Strength value for instant decision context.
Visuals are clean and compact — every symbol row sits inside a solid box so chart clutter is minimised and strength/direction read at a glance. Positive movements are highlighted in blue, negative in red. The Total Average is presented alongside the timeframe values and an interpreted label: “Strong Uptrend”, “Weak Uptrend”, “Neutral”, “Weak Downtrend”, “Strong Downtrend” — driven by configurable thresholds so you can tune sensitivity to your trading style.
Math logic (how it’s calculated):
Per timeframe percent change:
pct_tf = ((close_tf - open_tf) / open_tf) * 100
(calculated for W, D, H4, H1)
Normalize timeframes by simply using their signed percent changes (no external data):
values = [pct_W, pct_D, pct_H4, pct_H1]
Total Average Strength (arithmetic mean):
Total_Avg = sum(values) / 4
Strength interpretation (default thresholds — adjustable):
Total_Avg >= +0.50 -> Strong Uptrend
+0.15 <= Total_Avg < +0.50 -> Weak Uptrend
-0.15 < Total_Avg < +0.15 -> Neutral
-0.50 < Total_Avg <= -0.15 -> Weak Downtrend
Total_Avg <= -0.50 -> Strong Downtrend
This approach keeps the computation transparent and fast while giving a consolidated market-strength readout. Traders can change thresholds or weighting if preferred; the default provides a reliable, conservative filter for most setups.
Usage note: This tool is informational and made for analysis — it does not issue buy/sell signals. Always combine with your own strategy and risk management.
Disclaimer / Copyright:
© 2025 Thirdeyechart. All rights reserved. Redistribution, copying, or commercial use without permission is prohibited. The author is not responsible for any trading losses or financial decisions made using this indicator.
오픈 소스 스크립트
트레이딩뷰의 진정한 정신에 따라, 이 스크립트의 작성자는 이를 오픈소스로 공개하여 트레이더들이 기능을 검토하고 검증할 수 있도록 했습니다. 작성자에게 찬사를 보냅니다! 이 코드는 무료로 사용할 수 있지만, 코드를 재게시하는 경우 하우스 룰이 적용된다는 점을 기억하세요.
면책사항
해당 정보와 게시물은 금융, 투자, 트레이딩 또는 기타 유형의 조언이나 권장 사항으로 간주되지 않으며, 트레이딩뷰에서 제공하거나 보증하는 것이 아닙니다. 자세한 내용은 이용 약관을 참조하세요.
오픈 소스 스크립트
트레이딩뷰의 진정한 정신에 따라, 이 스크립트의 작성자는 이를 오픈소스로 공개하여 트레이더들이 기능을 검토하고 검증할 수 있도록 했습니다. 작성자에게 찬사를 보냅니다! 이 코드는 무료로 사용할 수 있지만, 코드를 재게시하는 경우 하우스 룰이 적용된다는 점을 기억하세요.
면책사항
해당 정보와 게시물은 금융, 투자, 트레이딩 또는 기타 유형의 조언이나 권장 사항으로 간주되지 않으며, 트레이딩뷰에서 제공하거나 보증하는 것이 아닙니다. 자세한 내용은 이용 약관을 참조하세요.