OPEN-SOURCE SCRIPT
업데이트됨 Buy/Sell Alert EMA with SuperFormula by zdmre

*** Use it at your own risk
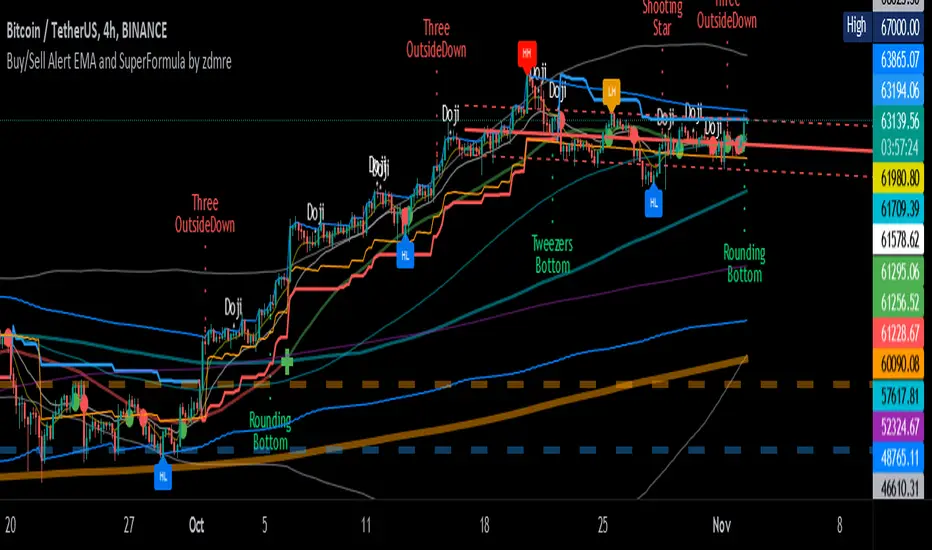
This indicator has 3 indicators and gives a buy/sell signal depending on the EMA.
3 indicators:
It also shows the value on the candle as a warning in the Buy and Sell signals. This value is calculated with a special formula I have created.
On the other hand Bollinger Band and Ichimoku Cloud are also included to check the accuracy of the signals.
For this indicator, I recommend a minimum of 4 hours chart.
This indicator has 3 indicators and gives a buy/sell signal depending on the EMA.
3 indicators:
- - Ichimoku
- - Bollinger Band
- - EMA
It also shows the value on the candle as a warning in the Buy and Sell signals. This value is calculated with a special formula I have created.
On the other hand Bollinger Band and Ichimoku Cloud are also included to check the accuracy of the signals.
For this indicator, I recommend a minimum of 4 hours chart.
릴리즈 노트
v 2.0-adding THEIL-SEN ESTIMATOR @tbiktag (Thanks my friend)
-changing default EMA values to 8-20
릴리즈 노트
Release Notes: v 3.0-Adding Bitcoin Investor Tool: 2-Year MA Multiplier + 1-Year MA
-Adding Pi Cycle Top Indicator
릴리즈 노트
Release Notes: Release Notes: v 4.0-Adding KAMA Indicator
-Adding Cup Indicator
릴리즈 노트
Max bar problem fixed.Trailing Stop Loss improved.
"Show Buy/Sell Signals" added. Default value=true
"Show Calculation Values" added. Default value=false
릴리즈 노트
Improved RSI, Sell Point, Calc Value Label.Added "Show TrailingSTOP Prices" label.
릴리즈 노트
Updated PineScript version 5Added Pattern Trend Calculations (Fibonacci, RSI, DMI)
Added Flagging
Added ZigZag (HH-HL-LH-LL)
Added Tables
Added Advanced Patterns
and more
릴리즈 노트
Removed KAMA,Removed Cup,
Removed Pattern Trend Calculations (Fibonacci, RSI, DMI)
Removed Tables,
Added Advanced Patterns
Added Cup and Handle.
Optimization and Visual improvements.
릴리즈 노트
Bug fixes.오픈 소스 스크립트
트레이딩뷰의 진정한 정신에 따라, 이 스크립트의 작성자는 이를 오픈소스로 공개하여 트레이더들이 기능을 검토하고 검증할 수 있도록 했습니다. 작성자에게 찬사를 보냅니다! 이 코드는 무료로 사용할 수 있지만, 코드를 재게시하는 경우 하우스 룰이 적용된다는 점을 기억하세요.
면책사항
해당 정보와 게시물은 금융, 투자, 트레이딩 또는 기타 유형의 조언이나 권장 사항으로 간주되지 않으며, 트레이딩뷰에서 제공하거나 보증하는 것이 아닙니다. 자세한 내용은 이용 약관을 참조하세요.
오픈 소스 스크립트
트레이딩뷰의 진정한 정신에 따라, 이 스크립트의 작성자는 이를 오픈소스로 공개하여 트레이더들이 기능을 검토하고 검증할 수 있도록 했습니다. 작성자에게 찬사를 보냅니다! 이 코드는 무료로 사용할 수 있지만, 코드를 재게시하는 경우 하우스 룰이 적용된다는 점을 기억하세요.
면책사항
해당 정보와 게시물은 금융, 투자, 트레이딩 또는 기타 유형의 조언이나 권장 사항으로 간주되지 않으며, 트레이딩뷰에서 제공하거나 보증하는 것이 아닙니다. 자세한 내용은 이용 약관을 참조하세요.