INVITE-ONLY SCRIPT
업데이트됨 QuantPivote
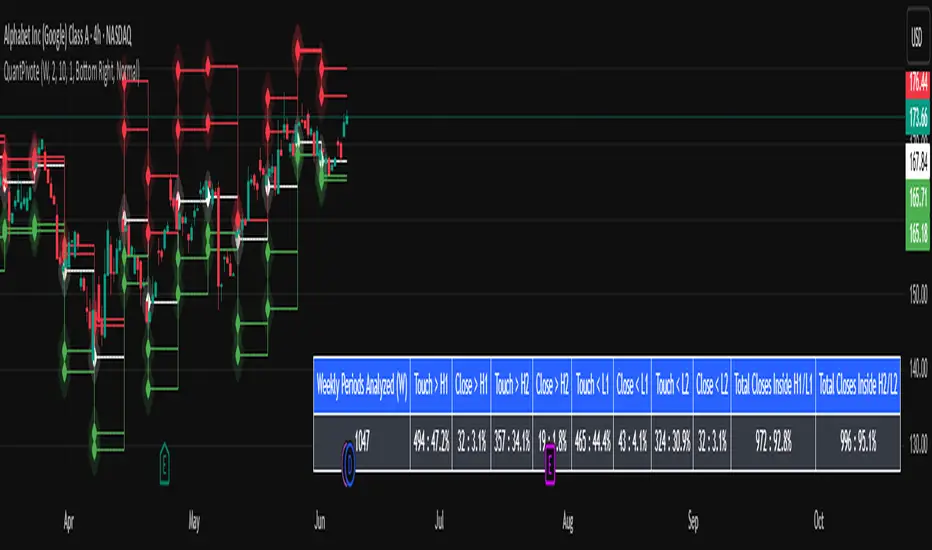
We are introducing the ST_QuantPivots Indicator, an advanced analytical tool meticulously crafted for ThinkOrSwim, which is now poised to debut on TradingView with Pine Script conversion.
Weekly Periods Analyzed :
Touch > H1 :
Close > H1 :
Touch > H2 :
Close > H2 :
Touch > L1 :
Close > L1 :
Touch > L2 :
Close > L2 :
Total Closes Inside H1 / L1 :
Total Closes Inside H2 / L2 :
Pivots :
Pivot lines are a function of the analysis and averaging period inputs.

Weekly Periods Analyzed :
- The number of total periods loaded and analyzed is on the chart.
Touch > H1 :
- Pivot level average price exceeded or was equal to, but did not close above.
Close > H1 :
- How often has the price closed above the H1 pivot level.
Touch > H2 :
- Pivot level one standard deviation above H1.
- The price exceeded or was equal to, but did not close above.
Close > H2 :
- How many times has the price closed above the H2 pivot level .
Touch > L1 :
- Pivot level average price exceeded or was equal to, but did not close below.
Close > L1 :
- How many times has the price closed below the L1 pivot level.
Touch > L2 :
- Pivot level one standard deviation below L1.
- The price exceeded or was equal to, but did not closed below.
Close > L2 :
- How many times has the price closed below the L2 pivot level.
Total Closes Inside H1 / L1 :
- Total number of times with in the periods analyzed that there were closes within H1 / L1 .
Total Closes Inside H2 / L2 :
- Total number of times with in the periods analyzed that there were closes within H2 / L2 respectively.
Pivots :
Pivot lines are a function of the analysis and averaging period inputs.
- H1 represents the average point which the highest price is achieved for the selected time period (analysis period).
- L1 represents the average point which the lowest price is achieved for the selected time period (analysis period).
- H2/L2 = One standard deviation away from the inner high H1 or low L1 bands.
릴리즈 노트
Updated to from pinescript v5 to pinescript v6초대 전용 스크립트
이 스크립트는 작성자가 승인한 사용자만 접근할 수 있습니다. 사용하려면 요청 후 승인을 받아야 하며, 일반적으로 결제 후에 허가가 부여됩니다. 자세한 내용은 아래 작성자의 안내를 따르거나 pineaflAlgo에게 직접 문의하세요.
트레이딩뷰는 스크립트의 작동 방식을 충분히 이해하고 작성자를 완전히 신뢰하지 않는 이상, 해당 스크립트에 비용을 지불하거나 사용하는 것을 권장하지 않습니다. 커뮤니티 스크립트에서 무료 오픈소스 대안을 찾아보실 수도 있습니다.
작성자 지시 사항
This is a paid indicator. Please contact the author for a week's trial access on Trading View chat or Message on telegram with the Tradingview username https://t.me/pineafl for new feature requests reach out to pramod@pineafl.com
PineaflAlgo
면책사항
해당 정보와 게시물은 금융, 투자, 트레이딩 또는 기타 유형의 조언이나 권장 사항으로 간주되지 않으며, 트레이딩뷰에서 제공하거나 보증하는 것이 아닙니다. 자세한 내용은 이용 약관을 참조하세요.
초대 전용 스크립트
이 스크립트는 작성자가 승인한 사용자만 접근할 수 있습니다. 사용하려면 요청 후 승인을 받아야 하며, 일반적으로 결제 후에 허가가 부여됩니다. 자세한 내용은 아래 작성자의 안내를 따르거나 pineaflAlgo에게 직접 문의하세요.
트레이딩뷰는 스크립트의 작동 방식을 충분히 이해하고 작성자를 완전히 신뢰하지 않는 이상, 해당 스크립트에 비용을 지불하거나 사용하는 것을 권장하지 않습니다. 커뮤니티 스크립트에서 무료 오픈소스 대안을 찾아보실 수도 있습니다.
작성자 지시 사항
This is a paid indicator. Please contact the author for a week's trial access on Trading View chat or Message on telegram with the Tradingview username https://t.me/pineafl for new feature requests reach out to pramod@pineafl.com
PineaflAlgo
면책사항
해당 정보와 게시물은 금융, 투자, 트레이딩 또는 기타 유형의 조언이나 권장 사항으로 간주되지 않으며, 트레이딩뷰에서 제공하거나 보증하는 것이 아닙니다. 자세한 내용은 이용 약관을 참조하세요.