INVITE-ONLY SCRIPT
업데이트됨 Auto Trendline & Breakout Alert(Linear / Log) Full-Version
Contents
Overall Introduction
This indicator is the best tool for breakout traders.
Drawing and evaluating the trend lines of multiple charts in different time frames is a very time-consuming and tedious task. In addition, being aware of breakouts in the shortest possible time requires constant monitoring.
With this tool, you can draw and classify trend lines in a fraction of a second and by placing an alert on any chart, you can receive notifications about breakouts, wherever you are.
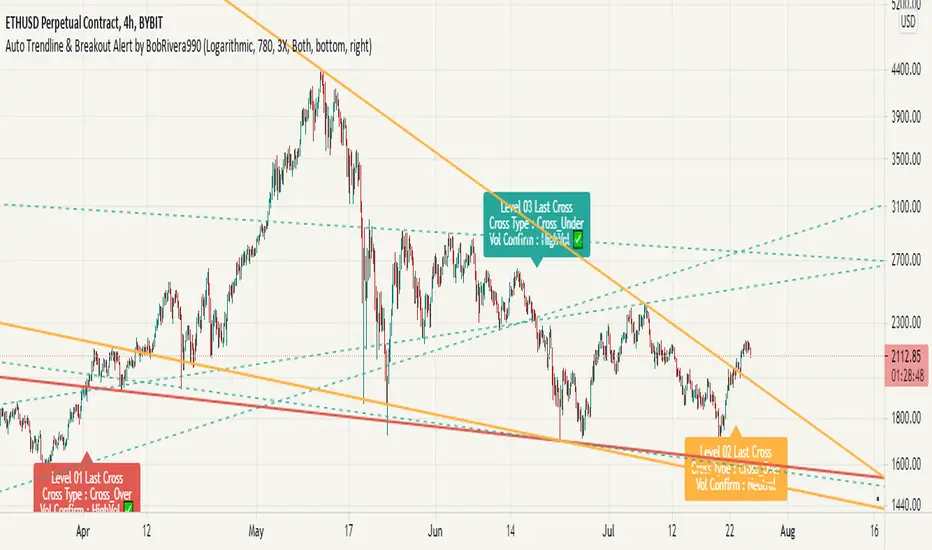
The classification of trend lines is done based on the reaction of the price chart to the trend lines and the analysis of the trading volume.
This indicator is designed to reclassify trend lines with each reaction of the price chart. These lines are classified into 6 levels and these levels are distinguished by different colors. Thus, any touching or crossing of the price chart can make a difference.
Does it repaint?
Any tool that shows trend lines must repaint because trend lines are constantly changing. Some lines lose their strength and new ones are formed, so some lines should be removed and replaced with new lines and that means repainting.
The indicator should reflect the latest changes. So while repainting is a bad thing in a strategy, it is essential in this indicator.
This indicator is designed to reclassify trend lines with each reaction of the price chart. Thus, any touching or crossing of the price chart can make a difference.
Note that unlike alerts, breakout labels are not trading signals:
Features
This indicator is designed for use on both linear and logarithmic scales. It works linearly by default. If you are using a logarithmic chart, enter the settings menu and set the chart scale parameter to “Log”.
The indicator is equipped with the volume status tool to identify and avoid false breakouts. Note that you can't completely avoid false breakouts, but you can minimize risk and loss. I have already published volume status as a separate script.
Several filters are provided to customize alerts. You can limit alerts based on the level and strength of broken trend lines, volume status, and type of breakout (Cross-Over, Cross-Under, or both).
The last breakouts panel gives an overview of the current market situation. You can activate it in the settings menu. the figure below shows the panel:

Settings menu parameters
{Chart Scale …} =>
Set it according to the chart. If you are using a linear chart, select the "Linear" option or if you are using a logarithmic chart, select the "Log" option
{Max Operational Range Length ...} =>
This parameter specifies the number of candles processed by the indicator (By default, the last 1000 bars)
{Filter Out-Of-Range Lines} =>
The filter removes diverging or out-of-range lines and reduces the clutter of the chart
{Visible Trend Lines ...} =>
In this section you can specify which level of trend lines should be visible. Level 1 contains the strongest lines and level 6 contains the weakest.
{Alert Condition 01 _ Trendline Levels} =>
In this section, you can specify which level of trend lines will trigger an alert after the breakout. This section has been added to customize alerts.
{Alert Condition 02 _ Cross Type} =>
In this section, you can limit alerts based on the type of breakout (Cross-Over, Cross-Under or both). This section has been added to customize alerts.
{Alert Condition 03 _ Volume Status} =>
In this section, you can limit alerts by volume to avoid fake breakouts. This section has been added to customize alerts.
{Last Breakout Label} =>
In this section, you can enable or disable the last breakout labels.
{Panel} =>
In this section, you can enable or disable the last breakout panel or set its position on the chart.
How to setup
There are many parameters in the settings menu, but two are more important. One is “Chart Scale” and the other is the “Max Operational Range Length".
Set the “chart scale” parameter according to the chart, otherwise the trend lines drawn by the indicator do not match the price chart.
If you are using a linear chart, select the "Linear" option or if you are using a logarithmic chart, select the "Log" option.
Max Operational Range Length Limits the range of the price chart that is processed by the indicator.
By increasing this parameter:
In the following figure, you can see the effects of increasing the “Max Operational Range Length" parameter:

Limits
Since this indicator makes extensive use of trading volume, it is necessary to use a chart with volume information.
But if the volume information is not provided by the vendor, indicator will continue to work based on the price chart only, and a warning message will be displayed below the chart to let you know.

Errors and Performance
The performance of this indicator depends on the “Max Operational Range Length” parameter in the settings menu because it performs calculations, within a range with the length of this parameter.
By increasing this parameter, the processing load increases. Sometimes you may encounter the following error: “Loop takes too long to execute (>200 ms)”
If you see this error, do one of the following:
Examples
EURUSD (FX:EURUSD) – 1D // Scale: Logarithmic, Max Range Length = 1000, Filter: 2X

NASDAQ 100 (CME_MINI:NQ1!) - 1D // Scale: Logarithmic, Max Range Length = 700

GOLD (COMEX:GC1!) – 1D // Scale: Logarithmic, Max Range Length = 650, Filter: 2X

NATURAL GAS (NYMEX:NG1!) – 1D // Scale: Logarithmic, Max Range Length = 625, Filter: 4X

AMAZON (NASDAQ:AMZN) – 1D // Scale: Logarithmic, Max Range Length = 1750, Filter: 2X

APPLE INC (NASDAQ:AAPL) – 1D // Scale: Logarithmic, Max Range Length = 340, Filter: 4X

GBPUSD (FX:GBPUSD) – 1D // Scale: Logarithmic, Max Range Length = 1000, Filter: 3X

SILVER (COMEX:SI1!) – 1D // Scale: Logarithmic, Max Range Length = 550, Filter: 3X

BITCOIN (KUCOIN:BTCUSDT) – 4H // Scale: Logarithmic, Max Range Length = 1250, Filter: 3X

MICROSOFT (NASDAQ:MSFT) – 1D // Scale: Logarithmic, Max Range Length = 340, Filter: 4X

TOTAL (CRYPTOCAP:TOTAL) – 2H // Scale: Logarithmic, Max Range Length = 1075, Filter: 3X

- Overall Introduction
- Does it repaint?
- Features
- Settings menu parameters
- How to setup
- Limits
- Errors and Performance
- Examples
Overall Introduction
This indicator is the best tool for breakout traders.
Drawing and evaluating the trend lines of multiple charts in different time frames is a very time-consuming and tedious task. In addition, being aware of breakouts in the shortest possible time requires constant monitoring.
With this tool, you can draw and classify trend lines in a fraction of a second and by placing an alert on any chart, you can receive notifications about breakouts, wherever you are.
The classification of trend lines is done based on the reaction of the price chart to the trend lines and the analysis of the trading volume.
This indicator is designed to reclassify trend lines with each reaction of the price chart. These lines are classified into 6 levels and these levels are distinguished by different colors. Thus, any touching or crossing of the price chart can make a difference.
Does it repaint?
Any tool that shows trend lines must repaint because trend lines are constantly changing. Some lines lose their strength and new ones are formed, so some lines should be removed and replaced with new lines and that means repainting.
The indicator should reflect the latest changes. So while repainting is a bad thing in a strategy, it is essential in this indicator.
This indicator is designed to reclassify trend lines with each reaction of the price chart. Thus, any touching or crossing of the price chart can make a difference.
Note that unlike alerts, breakout labels are not trading signals:
- Breakout labels show the latest breakout for each level based on the lines that appear on the chart, so they may repaint or have delay.
- But Alerts work differently, Alerts are triggered when one of the trend lines is broken and then the next candle is opened and has no any delay.
Features
This indicator is designed for use on both linear and logarithmic scales. It works linearly by default. If you are using a logarithmic chart, enter the settings menu and set the chart scale parameter to “Log”.
The indicator is equipped with the volume status tool to identify and avoid false breakouts. Note that you can't completely avoid false breakouts, but you can minimize risk and loss. I have already published volume status as a separate script.
Several filters are provided to customize alerts. You can limit alerts based on the level and strength of broken trend lines, volume status, and type of breakout (Cross-Over, Cross-Under, or both).
The last breakouts panel gives an overview of the current market situation. You can activate it in the settings menu. the figure below shows the panel:
Settings menu parameters
{Chart Scale …} =>
Set it according to the chart. If you are using a linear chart, select the "Linear" option or if you are using a logarithmic chart, select the "Log" option
{Max Operational Range Length ...} =>
This parameter specifies the number of candles processed by the indicator (By default, the last 1000 bars)
{Filter Out-Of-Range Lines} =>
The filter removes diverging or out-of-range lines and reduces the clutter of the chart
{Visible Trend Lines ...} =>
In this section you can specify which level of trend lines should be visible. Level 1 contains the strongest lines and level 6 contains the weakest.
{Alert Condition 01 _ Trendline Levels} =>
In this section, you can specify which level of trend lines will trigger an alert after the breakout. This section has been added to customize alerts.
{Alert Condition 02 _ Cross Type} =>
In this section, you can limit alerts based on the type of breakout (Cross-Over, Cross-Under or both). This section has been added to customize alerts.
{Alert Condition 03 _ Volume Status} =>
In this section, you can limit alerts by volume to avoid fake breakouts. This section has been added to customize alerts.
{Last Breakout Label} =>
In this section, you can enable or disable the last breakout labels.
{Panel} =>
In this section, you can enable or disable the last breakout panel or set its position on the chart.
How to setup
There are many parameters in the settings menu, but two are more important. One is “Chart Scale” and the other is the “Max Operational Range Length".
Set the “chart scale” parameter according to the chart, otherwise the trend lines drawn by the indicator do not match the price chart.
If you are using a linear chart, select the "Linear" option or if you are using a logarithmic chart, select the "Log" option.
Max Operational Range Length Limits the range of the price chart that is processed by the indicator.
By increasing this parameter:
- The strength and durability of the trend lines increases.
- The number of breakout signals decreases.
- The importance of breakout signals increases.
- The indicator processing load increases.
In the following figure, you can see the effects of increasing the “Max Operational Range Length" parameter:
Limits
Since this indicator makes extensive use of trading volume, it is necessary to use a chart with volume information.
But if the volume information is not provided by the vendor, indicator will continue to work based on the price chart only, and a warning message will be displayed below the chart to let you know.
Errors and Performance
The performance of this indicator depends on the “Max Operational Range Length” parameter in the settings menu because it performs calculations, within a range with the length of this parameter.
By increasing this parameter, the processing load increases. Sometimes you may encounter the following error: “Loop takes too long to execute (>200 ms)”
If you see this error, do one of the following:
- Reduce the “Max Operational Range Length”.
- Reset the indicator. To do this, double-click on the “Hide” button in front of the indicator name.
Examples
EURUSD (FX:EURUSD) – 1D // Scale: Logarithmic, Max Range Length = 1000, Filter: 2X
NASDAQ 100 (CME_MINI:NQ1!) - 1D // Scale: Logarithmic, Max Range Length = 700
GOLD (COMEX:GC1!) – 1D // Scale: Logarithmic, Max Range Length = 650, Filter: 2X
NATURAL GAS (NYMEX:NG1!) – 1D // Scale: Logarithmic, Max Range Length = 625, Filter: 4X
AMAZON (NASDAQ:AMZN) – 1D // Scale: Logarithmic, Max Range Length = 1750, Filter: 2X
APPLE INC (NASDAQ:AAPL) – 1D // Scale: Logarithmic, Max Range Length = 340, Filter: 4X
GBPUSD (FX:GBPUSD) – 1D // Scale: Logarithmic, Max Range Length = 1000, Filter: 3X
SILVER (COMEX:SI1!) – 1D // Scale: Logarithmic, Max Range Length = 550, Filter: 3X
BITCOIN (KUCOIN:BTCUSDT) – 4H // Scale: Logarithmic, Max Range Length = 1250, Filter: 3X
MICROSOFT (NASDAQ:MSFT) – 1D // Scale: Logarithmic, Max Range Length = 340, Filter: 4X
TOTAL (CRYPTOCAP:TOTAL) – 2H // Scale: Logarithmic, Max Range Length = 1075, Filter: 3X
릴리즈 노트
I just changed the title.릴리즈 노트
Preston Pysh estimates that there are around 200,000 blocks per Bitcoin cycle and around 144 blocks per day; therefore each cycle of Bitcoin lasts approximately 1389 days. I have set the default for the "Max Operational Range Length" parameter to 1389. This amount is suitable for the entire crypto market in 1-day timeframe.
For other financial markets or other time frames, set the parameter at your discretion.
릴리즈 노트
Bug fixed in drawing lines on the logarithmic scale.
초대 전용 스크립트
이 스크립트는 작성자가 승인한 사용자만 접근할 수 있습니다. 사용하려면 요청 후 승인을 받아야 하며, 일반적으로 결제 후에 허가가 부여됩니다. 자세한 내용은 아래 작성자의 안내를 따르거나 BobRivera990에게 직접 문의하세요.
트레이딩뷰는 스크립트의 작동 방식을 충분히 이해하고 작성자를 완전히 신뢰하지 않는 이상, 해당 스크립트에 비용을 지불하거나 사용하는 것을 권장하지 않습니다. 커뮤니티 스크립트에서 무료 오픈소스 대안을 찾아보실 수도 있습니다.
작성자 지시 사항
Send me a direct message on tradingview for a 7 day trial.
면책사항
해당 정보와 게시물은 금융, 투자, 트레이딩 또는 기타 유형의 조언이나 권장 사항으로 간주되지 않으며, 트레이딩뷰에서 제공하거나 보증하는 것이 아닙니다. 자세한 내용은 이용 약관을 참조하세요.