OPEN-SOURCE SCRIPT
Hancock - Floating O/B O/S IFT RSI T3MA
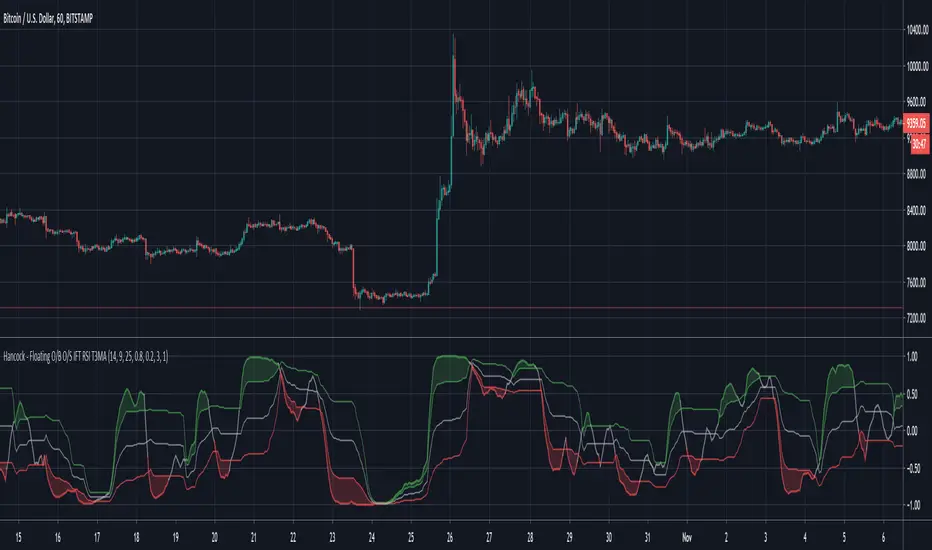
This is a version of the Inverse Fisher Transform Relative Strength Index with floating oversold and overbought thresholds.
Configurable parameters:
RSI length - This is the period used for the RSI .
RSI Smooth Length - This is the smoothing period of the Weighted Moving Average used for the smoothing in Inverse Fisher Transform .
RSI Threshold Period - This is the period used for calculating the floating oversold and overbought thresholds.
RSI Overbought - Configures the overbought threshold (80% default).
RSI Oversold - Configures the oversold threshold (20% default).
T3 Smoothing - Enabling this applies T3MA smoothing to the RSI.
T3 Length - This is the period used for the T3MA smoothing of the RSI.
T3 Factor - This is the factor used for the T3MA smoothing of the RSI.
RSI line breaching the thresholds are clearly indicated by filled chart plots.
An inverse Fisher transform of RSI is designed to enhance the extremes (overbought and oversold zones), in combination with floating thresholds this version allows faster and cleaner trend detection and identification. With additional smoothing, false signals can be avoided. As with any other indicator some experimenting with parameters is advised (in order to find optimal settings for symbol/time frame pair).
Happy trading folks!
Hancock
오픈 소스 스크립트
트레이딩뷰의 진정한 정신에 따라, 이 스크립트의 작성자는 이를 오픈소스로 공개하여 트레이더들이 기능을 검토하고 검증할 수 있도록 했습니다. 작성자에게 찬사를 보냅니다! 이 코드는 무료로 사용할 수 있지만, 코드를 재게시하는 경우 하우스 룰이 적용된다는 점을 기억하세요.
면책사항
해당 정보와 게시물은 금융, 투자, 트레이딩 또는 기타 유형의 조언이나 권장 사항으로 간주되지 않으며, 트레이딩뷰에서 제공하거나 보증하는 것이 아닙니다. 자세한 내용은 이용 약관을 참조하세요.
오픈 소스 스크립트
트레이딩뷰의 진정한 정신에 따라, 이 스크립트의 작성자는 이를 오픈소스로 공개하여 트레이더들이 기능을 검토하고 검증할 수 있도록 했습니다. 작성자에게 찬사를 보냅니다! 이 코드는 무료로 사용할 수 있지만, 코드를 재게시하는 경우 하우스 룰이 적용된다는 점을 기억하세요.
면책사항
해당 정보와 게시물은 금융, 투자, 트레이딩 또는 기타 유형의 조언이나 권장 사항으로 간주되지 않으며, 트레이딩뷰에서 제공하거나 보증하는 것이 아닙니다. 자세한 내용은 이용 약관을 참조하세요.