OPEN-SOURCE SCRIPT
Shifted Symbol Overlay with Offset
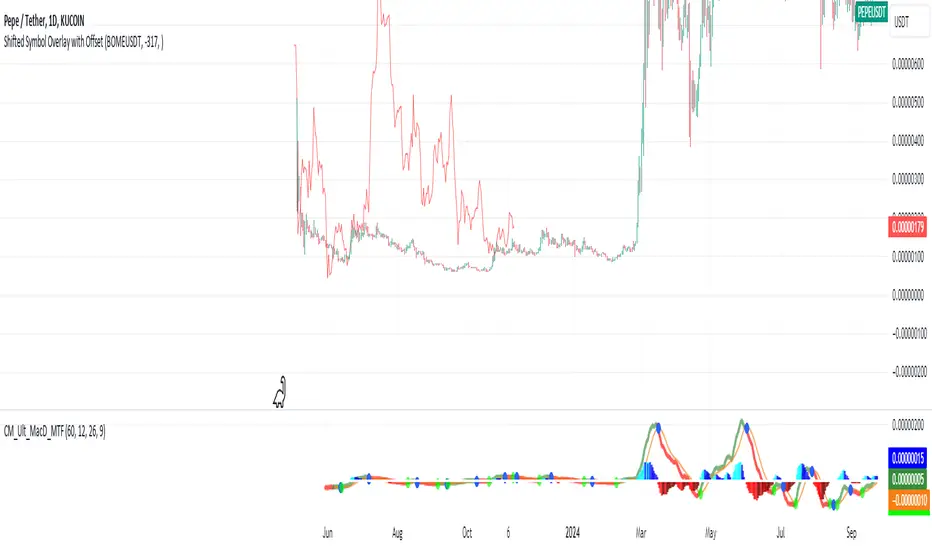
The Shifted Symbol Overlay Indicator is a custom TradingView indicator designed to overlay the price data of one stock or asset over another, allowing for direct visual comparison. This is particularly useful for comparing the performance of two assets over different time periods. The indicator enables you to shift the data from one asset either forward or backward in time, making it easier to compare historical data from one stock with more recent data from another. The indicator supports shifting both to the right (future periods) and to the left (earlier periods), helping traders and analysts explore correlations or divergences between two financial instruments.
The indicator also includes a normalization option that adjusts the scale of the two assets, so you can compare them even if they have vastly different price levels. This is useful when you're interested in relative performance rather than the absolute price values.
The indicator also includes a normalization option that adjusts the scale of the two assets, so you can compare them even if they have vastly different price levels. This is useful when you're interested in relative performance rather than the absolute price values.
오픈 소스 스크립트
트레이딩뷰의 진정한 정신에 따라, 이 스크립트의 작성자는 이를 오픈소스로 공개하여 트레이더들이 기능을 검토하고 검증할 수 있도록 했습니다. 작성자에게 찬사를 보냅니다! 이 코드는 무료로 사용할 수 있지만, 코드를 재게시하는 경우 하우스 룰이 적용된다는 점을 기억하세요.
면책사항
해당 정보와 게시물은 금융, 투자, 트레이딩 또는 기타 유형의 조언이나 권장 사항으로 간주되지 않으며, 트레이딩뷰에서 제공하거나 보증하는 것이 아닙니다. 자세한 내용은 이용 약관을 참조하세요.
오픈 소스 스크립트
트레이딩뷰의 진정한 정신에 따라, 이 스크립트의 작성자는 이를 오픈소스로 공개하여 트레이더들이 기능을 검토하고 검증할 수 있도록 했습니다. 작성자에게 찬사를 보냅니다! 이 코드는 무료로 사용할 수 있지만, 코드를 재게시하는 경우 하우스 룰이 적용된다는 점을 기억하세요.
면책사항
해당 정보와 게시물은 금융, 투자, 트레이딩 또는 기타 유형의 조언이나 권장 사항으로 간주되지 않으며, 트레이딩뷰에서 제공하거나 보증하는 것이 아닙니다. 자세한 내용은 이용 약관을 참조하세요.