OPEN-SOURCE SCRIPT
EU & US Open Signals (Triple Confirmation)
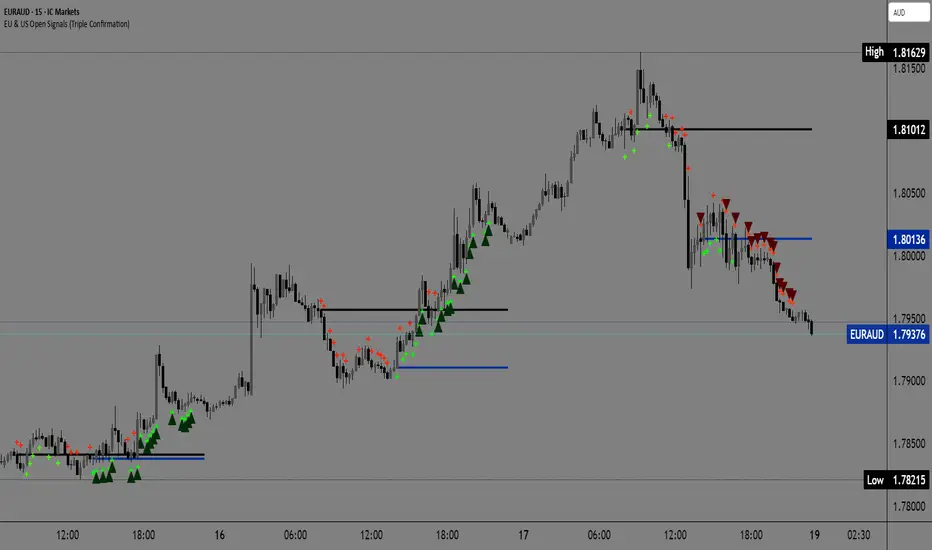
🚀 EU & US Open Signals: Triple Confirmation Breakouts
💡 What This Indicator Does
This indicator plots the opening prices of the European (EU) and American (US) trading sessions as key daily support/resistance levels. Its main function is to generate three distinct levels of signals based on the breakout of these levels, strictly filtered by candlestick type.
The goal is to easily spot market momentum following the opening of the major trading sessions.
🔑 Key Features
1. Daily Session Levels
The indicator plots two crucial horizontal lines that reset daily:
EU Open (Black Line): The European session opening price (Default: 06:00 UTC).
US Open (Dark Blue Line): The American session opening price (Default: 12:00 UTC).
2. Triple Signaling Logic
All signals are only generated if the breakout candle is bullish (for Buy) or bearish (for Sell), and only within your set trading hours.
Logic I. EU Single Break
Condition: Close breaks above/below the EU Open Level + Bullish/Bearish candle.
Visual Plot: Small Cross (Green for Buy / Red for Sell).
Meaning: Early signal focused on EU session momentum.
Logic II. US Single Break
Condition: Close breaks above/below the US Open Level + Bullish/Bearish candle.
Visual Plot: Small Cross (Green for Buy / Red for Sell).
Meaning: Signal focused on US session momentum.
Logic III. Double Break (HIGH CONFIRMATION)
Condition: Close breaks above Both Levels (EU and US) for Buy, or below Both Levels for Sell + Bullish/Bearish candle.
Visual Plot: Large Triangle (Dark Green/Red).
⚠️ Crucial: This is the strongest signal, indicating strong momentum as both key daily levels have been broken.
⚙️ Simple Settings
Easily customize the indicator to fit your strategy:
EU/US Session Open Hour (UTC): Set the exact session open times.
Time Zone: Select your time zone for accurate level calculation.
Start/End Trading Hour: Define the daily window for when signals will be active.
🎯 Recommended Use
High Confidence: Focus on the Double Break (Logic III) - Large Triangle for your most confirmed entries.
Context: Use the Single Break signals (I and II) to confirm early market bias.
Risk: The Open Levels can serve as natural points for setting Stop-Loss orders.
Disclaimer: Trading carries risk. This tool is for analysis purposes only. Use it at your own discretion.
오픈 소스 스크립트
트레이딩뷰의 진정한 정신에 따라, 이 스크립트의 작성자는 이를 오픈소스로 공개하여 트레이더들이 기능을 검토하고 검증할 수 있도록 했습니다. 작성자에게 찬사를 보냅니다! 이 코드는 무료로 사용할 수 있지만, 코드를 재게시하는 경우 하우스 룰이 적용된다는 점을 기억하세요.
Free telegram channel t.me/alexmasterforex
면책사항
해당 정보와 게시물은 금융, 투자, 트레이딩 또는 기타 유형의 조언이나 권장 사항으로 간주되지 않으며, 트레이딩뷰에서 제공하거나 보증하는 것이 아닙니다. 자세한 내용은 이용 약관을 참조하세요.