OPEN-SOURCE SCRIPT
Ross Cameron-Inspired Day Trading Strategy
Explanation for Community Members:
Title: Ross Cameron-Inspired Day Trading Strategy
Description:
This script is designed to help you identify potential buy and sell opportunities during the trading day. It combines several popular trading strategies to provide clear signals.
Key Features:
Gap and Go: Identifies stocks that have gapped up or down at the open.
Momentum Trading: Uses RSI and EMA to identify momentum-based entry points.
Mean Reversion: Uses RSI and SMA to identify potential reversals.
How to Use:
Apply to Chart: Add this script to your TradingView chart.
Set Timeframe: Works best on 5-minute and 10-minute timeframes.
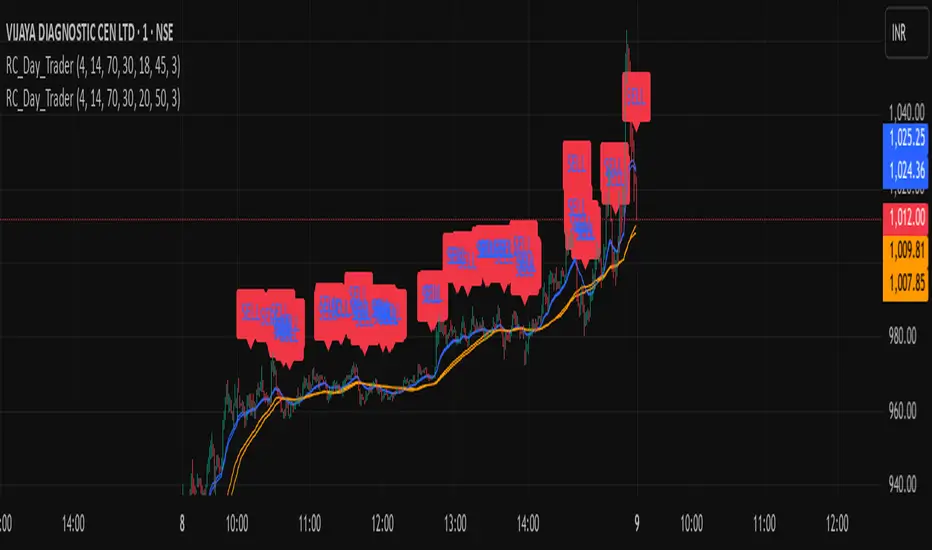
Watch for Signals: Look for green "BUY" labels for entry points and red "SELL" labels for exit points.
Parameters:
Gap Percentage: Adjust to identify larger or smaller gaps.
RSI Settings: Customize the RSI length and overbought/oversold levels.
EMA and SMA Lengths: Adjust the lengths of the moving averages.
Confirmation Period: Set how many bars to wait for confirmation.
Visual Elements:
BUY Signals: Green labels below the price bars.
SELL Signals: Red labels above the price bars.
Indicators: Displays EMA (blue) and SMA (orange) for additional context.
This script is a powerful tool for day trading on NSE and BSE indices, combining multiple strategies to provide robust trading signals. Adjust the parameters to suit your trading style and always combine with your own analysis for best results.
Title: Ross Cameron-Inspired Day Trading Strategy
Description:
This script is designed to help you identify potential buy and sell opportunities during the trading day. It combines several popular trading strategies to provide clear signals.
Key Features:
Gap and Go: Identifies stocks that have gapped up or down at the open.
Momentum Trading: Uses RSI and EMA to identify momentum-based entry points.
Mean Reversion: Uses RSI and SMA to identify potential reversals.
How to Use:
Apply to Chart: Add this script to your TradingView chart.
Set Timeframe: Works best on 5-minute and 10-minute timeframes.
Watch for Signals: Look for green "BUY" labels for entry points and red "SELL" labels for exit points.
Parameters:
Gap Percentage: Adjust to identify larger or smaller gaps.
RSI Settings: Customize the RSI length and overbought/oversold levels.
EMA and SMA Lengths: Adjust the lengths of the moving averages.
Confirmation Period: Set how many bars to wait for confirmation.
Visual Elements:
BUY Signals: Green labels below the price bars.
SELL Signals: Red labels above the price bars.
Indicators: Displays EMA (blue) and SMA (orange) for additional context.
This script is a powerful tool for day trading on NSE and BSE indices, combining multiple strategies to provide robust trading signals. Adjust the parameters to suit your trading style and always combine with your own analysis for best results.
오픈 소스 스크립트
트레이딩뷰의 진정한 정신에 따라, 이 스크립트의 작성자는 이를 오픈소스로 공개하여 트레이더들이 기능을 검토하고 검증할 수 있도록 했습니다. 작성자에게 찬사를 보냅니다! 이 코드는 무료로 사용할 수 있지만, 코드를 재게시하는 경우 하우스 룰이 적용된다는 점을 기억하세요.
면책사항
해당 정보와 게시물은 금융, 투자, 트레이딩 또는 기타 유형의 조언이나 권장 사항으로 간주되지 않으며, 트레이딩뷰에서 제공하거나 보증하는 것이 아닙니다. 자세한 내용은 이용 약관을 참조하세요.
오픈 소스 스크립트
트레이딩뷰의 진정한 정신에 따라, 이 스크립트의 작성자는 이를 오픈소스로 공개하여 트레이더들이 기능을 검토하고 검증할 수 있도록 했습니다. 작성자에게 찬사를 보냅니다! 이 코드는 무료로 사용할 수 있지만, 코드를 재게시하는 경우 하우스 룰이 적용된다는 점을 기억하세요.
면책사항
해당 정보와 게시물은 금융, 투자, 트레이딩 또는 기타 유형의 조언이나 권장 사항으로 간주되지 않으며, 트레이딩뷰에서 제공하거나 보증하는 것이 아닙니다. 자세한 내용은 이용 약관을 참조하세요.