PROTECTED SOURCE SCRIPT
업데이트됨 ATR & RSI Confluence
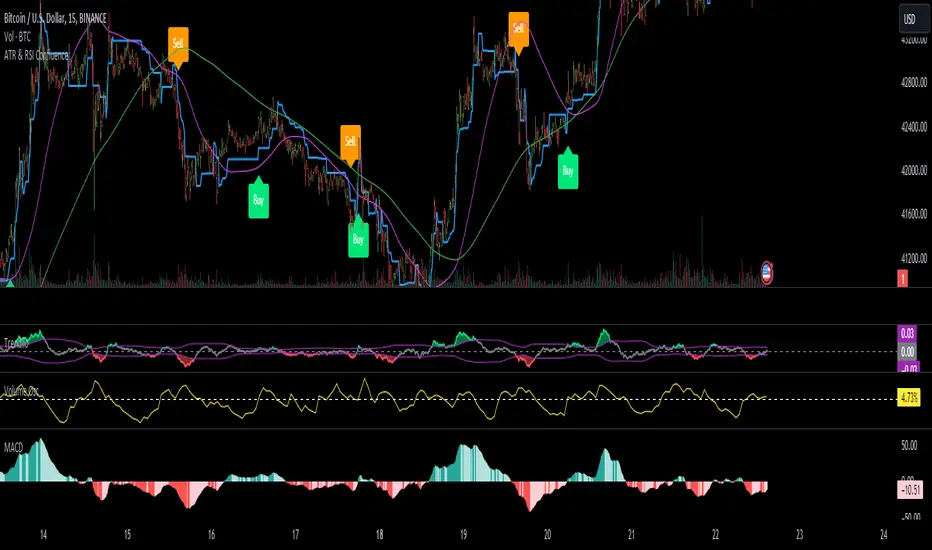
Introducing the "Confluence Strategy": Your Go-To for Savvy Trading!
1.ATR Trailing Stop - Your Market Volatility Compass:
What's ATR? Think of it as the pulse of market excitement. It measures how wildly prices are swinging.
ATR Trailing Stop: This is where the magic happens. Picture it as a dynamic line that dances with the price. When the market climbs, it climbs; when the market drops, it drops. It's your trend-tailored safety net, ensuring you ride the waves but bail before the tide turns!
2. RSI - The Market's Mood Ring:
RSI Lowdown: It's like a speedometer for price moves. Ranges from 0 to 100 – the closer to 100, the more it hints that prices might take a breather (overbought), and the closer to 0, the more it suggests prices might jump back up (oversold).
RSI Filter in Action: We're flipping the script here. No selling if the market's not in the oversold zone, and no buying if it's not feeling overbought. We're after that sweet momentum!
3. HEMA and Hull EMA - Your Trend Trackers:
HEMA & Hull EMA: These aren't your grandpa's moving averages. They're faster, sharper, and ready to catch the latest price trends. Like a hawk eyeing its prey, they zero in on the latest market moves.
4. Buy/Sell Signals - Where the Thrill Happens:
Buying (LONG): It's go-time when:
The price is strutting above HEMA.
RSI is strutting its stuff above the overbought catwalk.
ATR trailing stop is nodding along with an uptrend.
And hey, you're not already riding the long wave.
Selling (SHORT): You make your move when:
The price is dipping below HEMA.
RSI is lurking below the oversold alley.
ATR trailing stop is signaling a downhill.
And you're not already surfing the short tide.
How to Rock this Strategy:
New traders, tune in! This strategy's like a symphony of indicators – trend (HEMA and Hull EMA), momentum (RSI), and market volatility (ATR) – all harmonizing to cue your entry points. It's about syncing with the market's rhythm to up your trade game.
Absolutely, let's fine-tune it to a snappier beat:
Rock Your Trades with "Confluence Strategy," MACD & Volume Oscillator!
🔥 MACD: Set at 72/144 for a Smooth Groove:
Think of MACD (72/144 settings) as your market groove detector. It's calibrated to catch longer-term trends and momentum, perfect for harmonizing with our "Confluence Strategy." This setting helps smooth out market noise, giving you a clearer picture of the trend.
🎛️ Volume Oscillator: Your 0% Beat Check:
The Volume Oscillator is your go-to for checking the market's pulse. It's simple: look for it to be above 0% when considering a trade. This indicates that the market is vibing with enough volume to support your move, adding an extra layer of confidence to your strategy.
🚀 Trading Symphony:
Together, "Confluence Strategy," MACD (72/144), and a positive Volume Oscillator create a powerful trio. They align your trades with the market's rhythm and volume energy, setting you up for potentially harmonious and profitable trades.
Remember, the best tunes are played with practice. Test this setup, feel its rhythm, and when you're ready, let your trades sing on the market charts!
릴리즈 노트
Oppdate보호된 스크립트입니다
이 스크립트는 비공개 소스로 게시됩니다. 하지만 이를 자유롭게 제한 없이 사용할 수 있습니다 – 자세한 내용은 여기에서 확인하세요.
Spira Scalper
면책사항
해당 정보와 게시물은 금융, 투자, 트레이딩 또는 기타 유형의 조언이나 권장 사항으로 간주되지 않으며, 트레이딩뷰에서 제공하거나 보증하는 것이 아닙니다. 자세한 내용은 이용 약관을 참조하세요.
보호된 스크립트입니다
이 스크립트는 비공개 소스로 게시됩니다. 하지만 이를 자유롭게 제한 없이 사용할 수 있습니다 – 자세한 내용은 여기에서 확인하세요.
Spira Scalper
면책사항
해당 정보와 게시물은 금융, 투자, 트레이딩 또는 기타 유형의 조언이나 권장 사항으로 간주되지 않으며, 트레이딩뷰에서 제공하거나 보증하는 것이 아닙니다. 자세한 내용은 이용 약관을 참조하세요.