OPEN-SOURCE SCRIPT
업데이트됨 WaveMacBoll
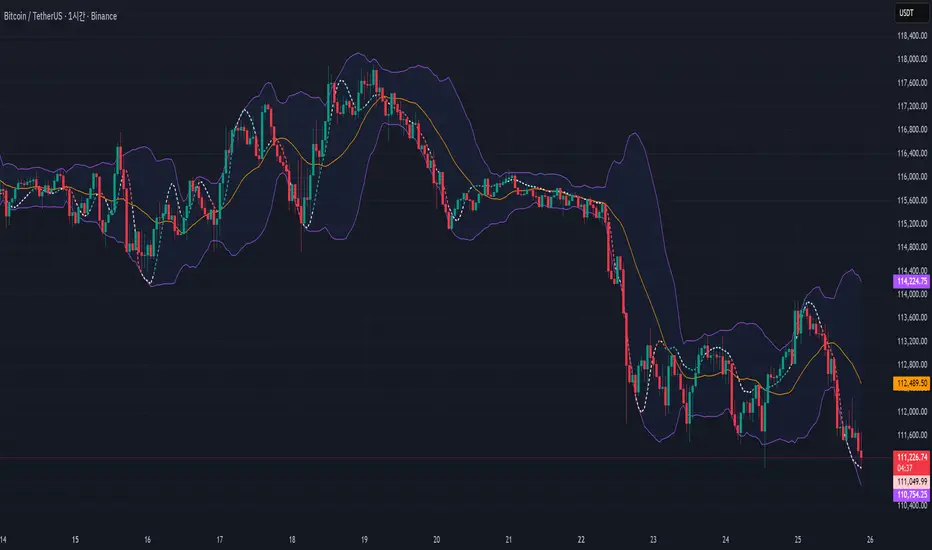
I wanted to see the two indicators in the candle chart, not in a separate window. And within the Bollinger band, it seemed to put it fine.
Important Note on Line Styles
Due to TradingView's multi-timeframe environment restrictions (timeframe = '', timeframe_gaps = true), I couldn't implement dotted or dashed line styles programmatically. The indicator uses solid lines by default.
If you prefer dotted/dashed lines for better visual distinction:
Add the indicator to your chart
Click on the indicator settings (gear icon)
Go to "Style" tab
Manually change line styles for each plot
Unfortunately, PineScript doesn't support line.new() or similar drawing functions in multi-timeframe mode, limiting our styling options to basic plot styles.
If you know a good solution for implementing dotted/dashed lines in multi-timeframe indicators without using drawing objects, please share it in the comments! I'd love to improve this aspect of the indicator
릴리즈 노트
.오픈 소스 스크립트
트레이딩뷰의 진정한 정신에 따라, 이 스크립트의 작성자는 이를 오픈소스로 공개하여 트레이더들이 기능을 검토하고 검증할 수 있도록 했습니다. 작성자에게 찬사를 보냅니다! 이 코드는 무료로 사용할 수 있지만, 코드를 재게시하는 경우 하우스 룰이 적용된다는 점을 기억하세요.
면책사항
해당 정보와 게시물은 금융, 투자, 트레이딩 또는 기타 유형의 조언이나 권장 사항으로 간주되지 않으며, 트레이딩뷰에서 제공하거나 보증하는 것이 아닙니다. 자세한 내용은 이용 약관을 참조하세요.
오픈 소스 스크립트
트레이딩뷰의 진정한 정신에 따라, 이 스크립트의 작성자는 이를 오픈소스로 공개하여 트레이더들이 기능을 검토하고 검증할 수 있도록 했습니다. 작성자에게 찬사를 보냅니다! 이 코드는 무료로 사용할 수 있지만, 코드를 재게시하는 경우 하우스 룰이 적용된다는 점을 기억하세요.
면책사항
해당 정보와 게시물은 금융, 투자, 트레이딩 또는 기타 유형의 조언이나 권장 사항으로 간주되지 않으며, 트레이딩뷰에서 제공하거나 보증하는 것이 아닙니다. 자세한 내용은 이용 약관을 참조하세요.