PROTECTED SOURCE SCRIPT
RSI ADX D-Line
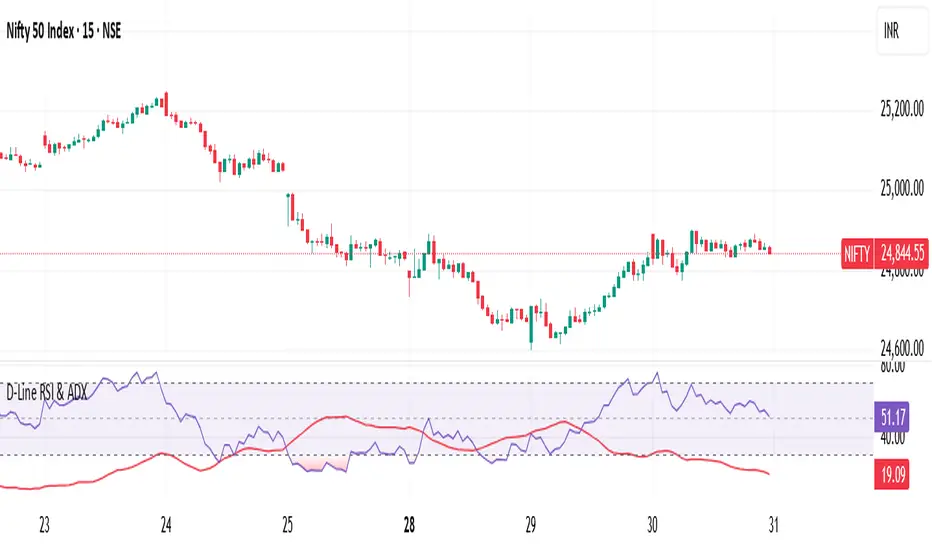
The D-Line RSI & ADX indicator combines the Relative Strength Index (RSI) with the Average Directional Index (ADX) to provide traders with a dual perspective on market momentum and trend strength. The RSI (purple line) measures the speed and change of price movements, helping traders identify overbought and oversold conditions. The ADX (red line) gauges the strength of the prevailing trend, assisting traders in filtering out ranging markets and focusing only on strong trends.
This indicator is designed to work on all timeframes and instruments. It helps traders confirm signals: for example, look for entries when RSI shows potential reversals while the ADX confirms the trend’s strength.
Key Features:
Clear RSI and ADX visualization on a single pane
Easily spot trend continuation or reversal setups
Suitable for intraday, swing, or positional trading
How to Use:
When RSI crosses above 70 or below 30, watch for potential reversals.
When ADX is above 20-25, it signals a strong trend; below indicates a weak or ranging market.
Combine RSI overbought/oversold levels with ADX trend confirmation for higher probability trades.
Ideal For:
Traders who want to enhance their decision-making with momentum and trend strength confirmation in one tool.
보호된 스크립트입니다
이 스크립트는 비공개 소스로 게시됩니다. 하지만 이를 자유롭게 제한 없이 사용할 수 있습니다 – 자세한 내용은 여기에서 확인하세요.
면책사항
해당 정보와 게시물은 금융, 투자, 트레이딩 또는 기타 유형의 조언이나 권장 사항으로 간주되지 않으며, 트레이딩뷰에서 제공하거나 보증하는 것이 아닙니다. 자세한 내용은 이용 약관을 참조하세요.
보호된 스크립트입니다
이 스크립트는 비공개 소스로 게시됩니다. 하지만 이를 자유롭게 제한 없이 사용할 수 있습니다 – 자세한 내용은 여기에서 확인하세요.
면책사항
해당 정보와 게시물은 금융, 투자, 트레이딩 또는 기타 유형의 조언이나 권장 사항으로 간주되지 않으며, 트레이딩뷰에서 제공하거나 보증하는 것이 아닙니다. 자세한 내용은 이용 약관을 참조하세요.