INVITE-ONLY SCRIPT
SagaView

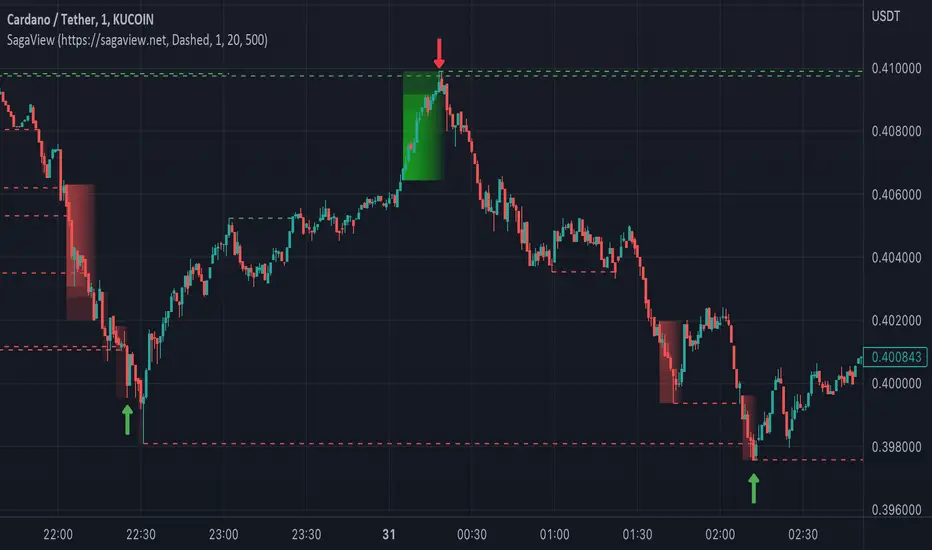
SagaView is an author's analytical tool where the visual part consists of zones and levels (these parts are described in more detail below).
This indicator allows you to determine whether the market is oversold or overbought, and use the levels of the indicator to determine the probability of price reversal.
SagaView Zones
SagaView zones show areas of the market that are overbought/oversold. These zones are determined on the basis of the closing prices of the previous bars. SagaView zones may differ in size (number of candles included in the shaded area). The larger the size of the zone, the higher the probability of an imminent price reversal. Also, in the case of a smaller zone size, it can indicate the emergence of a strong movement. SagaView levels are used to determine the potential of movement and probability of reversal.
SagaView levels
SagaView levels are built from local extremums. These levels are potential levels of resistance or support. A large number of crossings of the level by the price usually reduces its importance. SagaView levels display a line on the chart only until it is crossed by price to filter a weak levels. Also, a level can lose its strength over time. But in SagaView you can filter out levels that are too old (even if they have not been crossed by price).
Using SagaView
Thus, the SagaView zones make it possible to determine the trending areas of the market (a number of bars in the shaded area), and the SagaView levels make it possible to assess the probability of a price reversal in these areas.
Disclamer: remember that financial markets carry risks and no trading tool will guarantee you earnings.
Only your cold mind and knowledge.
초대 전용 스크립트
이 스크립트는 작성자가 승인한 사용자만 접근할 수 있습니다. 사용하려면 요청 후 승인을 받아야 하며, 일반적으로 결제 후에 허가가 부여됩니다. 자세한 내용은 아래 작성자의 안내를 따르거나 NorveComp에게 직접 문의하세요.
트레이딩뷰는 스크립트의 작동 방식을 충분히 이해하고 작성자를 완전히 신뢰하지 않는 이상, 해당 스크립트에 비용을 지불하거나 사용하는 것을 권장하지 않습니다. 커뮤니티 스크립트에서 무료 오픈소스 대안을 찾아보실 수도 있습니다.
작성자 지시 사항
Get access here: https://sagaview.net
면책사항
해당 정보와 게시물은 금융, 투자, 트레이딩 또는 기타 유형의 조언이나 권장 사항으로 간주되지 않으며, 트레이딩뷰에서 제공하거나 보증하는 것이 아닙니다. 자세한 내용은 이용 약관을 참조하세요.