OPEN-SOURCE SCRIPT
Gator Tail
Gator Tail
Building on Bill William’s Alligator, the Gator Tail provides the trader with a scaled value of deviation between the market price and the rolling average. Meant to be used as a trend reversal indicator, best results when combined with the Awesome Oscillator (AO).
Script Theory Basics
This script is based off of the Bill Williams Alligator indicator. In this indicator, the variance between the ‘jaw’ and the current price represents the deviation of price from its average. Using the alligator, the trader must identify this using their eye only. This script provides a numerical value, charted in histogram format like the Awesome Oscillator. Using the two in tandem allows the trader to identify reversal points and act on positions accordingly.
Script Technicalities
The Gator Tail value is derived as follows. To preface, the ‘jaw’ is a 13 period simple moving average, plotted 8 periods into the future on the chart. A calculation is performed on the ‘jaw’ value to extract its current value less the offset. This value is compared to the current price at the time of printing the equation. Price takes the hl2 value (high + low / 2). The variance between the two values is calculated by subtracting the jaw offset from the price value, and dividing this value by the offset value ([price - jaw offset] / jaw offset). This value prints as an absolute (irrespective of positive or negative) and gets plotted on the chart for the period. The range of values is 0.00 to 1.00.
Using Gator Tail
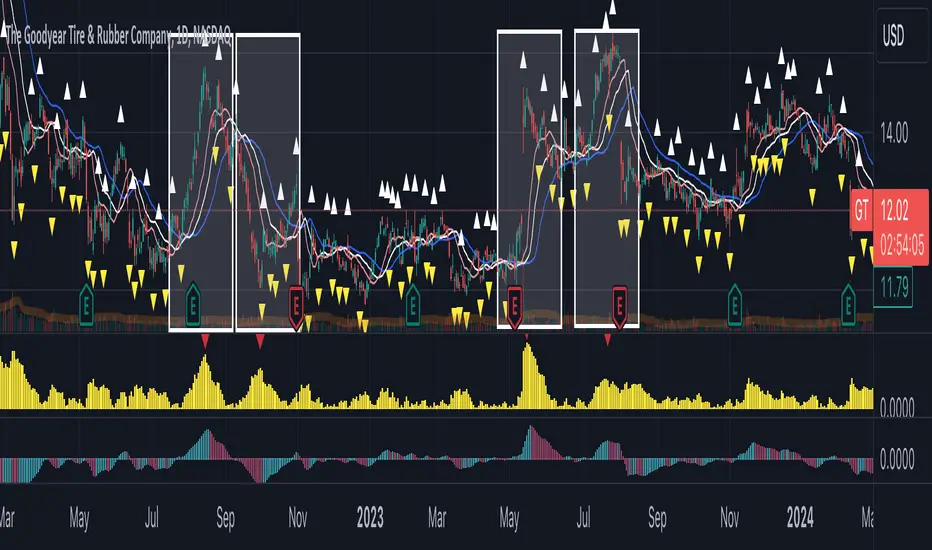
Any value above 0.20 is considered to be in the warning range. Values exceeding the 0.35-0.40 range are considered to be highly deviated. Highly deviated Gator Tail values combined with a color reversal from the AO indicate an entry/exit point in the chart. Using the two indicators on top of one another provides an easy visual cue to identify market reversal points. In the example chart above, we can see the red arrows on the Gator Tail coinciding with the AO reversals to result in the chart movements in the candlestick pane.
Limitations
This indicator does not work well with cryptocurrencies (altcoins or otherwise). The prices in these markets have few ties to macroeconomic trends or performance of an underlying asset. When testing this script, it was not found to be a reliable predictor of market reversals. This script is meant to be used with standard equities (stocks, stock options, currencies) where markets follow a reasonable level of predictability and have some underlying tie to real world events and relativity to historical prices.
Building on Bill William’s Alligator, the Gator Tail provides the trader with a scaled value of deviation between the market price and the rolling average. Meant to be used as a trend reversal indicator, best results when combined with the Awesome Oscillator (AO).
Script Theory Basics
This script is based off of the Bill Williams Alligator indicator. In this indicator, the variance between the ‘jaw’ and the current price represents the deviation of price from its average. Using the alligator, the trader must identify this using their eye only. This script provides a numerical value, charted in histogram format like the Awesome Oscillator. Using the two in tandem allows the trader to identify reversal points and act on positions accordingly.
Script Technicalities
The Gator Tail value is derived as follows. To preface, the ‘jaw’ is a 13 period simple moving average, plotted 8 periods into the future on the chart. A calculation is performed on the ‘jaw’ value to extract its current value less the offset. This value is compared to the current price at the time of printing the equation. Price takes the hl2 value (high + low / 2). The variance between the two values is calculated by subtracting the jaw offset from the price value, and dividing this value by the offset value ([price - jaw offset] / jaw offset). This value prints as an absolute (irrespective of positive or negative) and gets plotted on the chart for the period. The range of values is 0.00 to 1.00.
Using Gator Tail
Any value above 0.20 is considered to be in the warning range. Values exceeding the 0.35-0.40 range are considered to be highly deviated. Highly deviated Gator Tail values combined with a color reversal from the AO indicate an entry/exit point in the chart. Using the two indicators on top of one another provides an easy visual cue to identify market reversal points. In the example chart above, we can see the red arrows on the Gator Tail coinciding with the AO reversals to result in the chart movements in the candlestick pane.
Limitations
This indicator does not work well with cryptocurrencies (altcoins or otherwise). The prices in these markets have few ties to macroeconomic trends or performance of an underlying asset. When testing this script, it was not found to be a reliable predictor of market reversals. This script is meant to be used with standard equities (stocks, stock options, currencies) where markets follow a reasonable level of predictability and have some underlying tie to real world events and relativity to historical prices.
오픈 소스 스크립트
트레이딩뷰의 진정한 정신에 따라, 이 스크립트의 작성자는 이를 오픈소스로 공개하여 트레이더들이 기능을 검토하고 검증할 수 있도록 했습니다. 작성자에게 찬사를 보냅니다! 이 코드는 무료로 사용할 수 있지만, 코드를 재게시하는 경우 하우스 룰이 적용된다는 점을 기억하세요.
면책사항
해당 정보와 게시물은 금융, 투자, 트레이딩 또는 기타 유형의 조언이나 권장 사항으로 간주되지 않으며, 트레이딩뷰에서 제공하거나 보증하는 것이 아닙니다. 자세한 내용은 이용 약관을 참조하세요.
오픈 소스 스크립트
트레이딩뷰의 진정한 정신에 따라, 이 스크립트의 작성자는 이를 오픈소스로 공개하여 트레이더들이 기능을 검토하고 검증할 수 있도록 했습니다. 작성자에게 찬사를 보냅니다! 이 코드는 무료로 사용할 수 있지만, 코드를 재게시하는 경우 하우스 룰이 적용된다는 점을 기억하세요.
면책사항
해당 정보와 게시물은 금융, 투자, 트레이딩 또는 기타 유형의 조언이나 권장 사항으로 간주되지 않으며, 트레이딩뷰에서 제공하거나 보증하는 것이 아닙니다. 자세한 내용은 이용 약관을 참조하세요.