OPEN-SOURCE SCRIPT
Bitcoin Cycle [BigBeluga]
Bitcoin Cycle Indicator is designed exclusively for analyzing Bitcoin’s long-term market cycles, working only on the 1D BTC chart. This indicator provides an in-depth view of potential cycle tops and bottoms, assisting traders in identifying key phases in Bitcoin’s market evolution.
🔵 Key Features:
🔵 When to Use:
Ideal for long-term Bitcoin investors and cycle analysts, the Bitcoin Cycle Indicator empowers users to:
By visualizing Bitcoin’s cycles with color-coded clarity and top/bottom markers, this indicator is an essential tool for any BTC analyst aiming to navigate market cycles effectively.
🔵 Key Features:
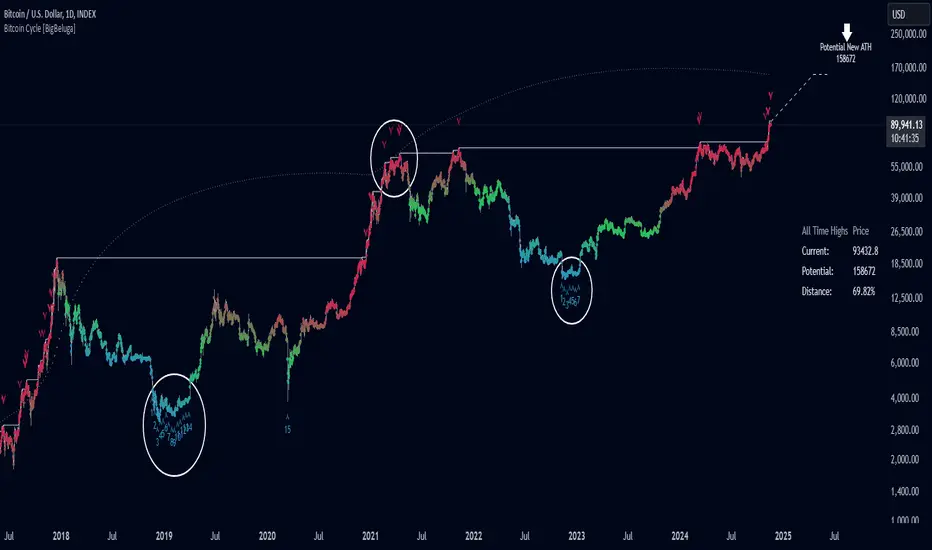
- Heatmap Cycle Phases: The indicator colors each cycle from blue to red, reflecting Bitcoin’s market cycle progression. Cooler colors (blue/green) signal potential accumulation or early growth phases, while warmer colors (yellow/red) indicate maturation and potential top regions.
- All-Time High (ATH) and Future ATH Projection: Tracks the current ATH in real-time, while applying a linear regression model to project a possible new ATH in the future. This projection aims to provide insights into the next major cycle peak for long-term strategy.
- Dashboard Overview: Displays the current ATH, potential new ATH, and the percentage distance between them. This helps users assess how far the current price is from the projected target.
- Top & Bottom Cycle Signals: Red down arrows mark significant price peaks, potentially indicating cycle tops. Up arrows, numbered sequentially (inside each cycle), denote possible bottom signals for strategic DCA (Dollar Cost Averaging) entries.
- 1D BTC Chart Only: Built solely for the 1D BTC timeframe. Switching to any other timeframe or asset will trigger a warning message: "BTC 1D Only." This ensures accuracy in analyzing Bitcoin’s unique cyclical behavior.
🔵 When to Use:
Ideal for long-term Bitcoin investors and cycle analysts, the Bitcoin Cycle Indicator empowers users to:
- Identify key accumulation and distribution phases.
- Track Bitcoin’s cyclical highs and lows with visual heatmap cues.
- Estimate future potential highs based on historical patterns.
- Strategize long-term positions by monitoring cycle tops and possible accumulation zones.
By visualizing Bitcoin’s cycles with color-coded clarity and top/bottom markers, this indicator is an essential tool for any BTC analyst aiming to navigate market cycles effectively.
오픈 소스 스크립트
트레이딩뷰의 진정한 정신에 따라, 이 스크립트의 작성자는 이를 오픈소스로 공개하여 트레이더들이 기능을 검토하고 검증할 수 있도록 했습니다. 작성자에게 찬사를 보냅니다! 이 코드는 무료로 사용할 수 있지만, 코드를 재게시하는 경우 하우스 룰이 적용된다는 점을 기억하세요.
🔵Gain access to our powerful tools : bigbeluga.com/tv
🔵Join our free discord for updates : bigbeluga.com/discord
All scripts & content provided by BigBeluga are for informational & educational purposes only.
🔵Join our free discord for updates : bigbeluga.com/discord
All scripts & content provided by BigBeluga are for informational & educational purposes only.
면책사항
해당 정보와 게시물은 금융, 투자, 트레이딩 또는 기타 유형의 조언이나 권장 사항으로 간주되지 않으며, 트레이딩뷰에서 제공하거나 보증하는 것이 아닙니다. 자세한 내용은 이용 약관을 참조하세요.