PROTECTED SOURCE SCRIPT
UniqueHorn - MA Indicator with SMI
📊 Overview
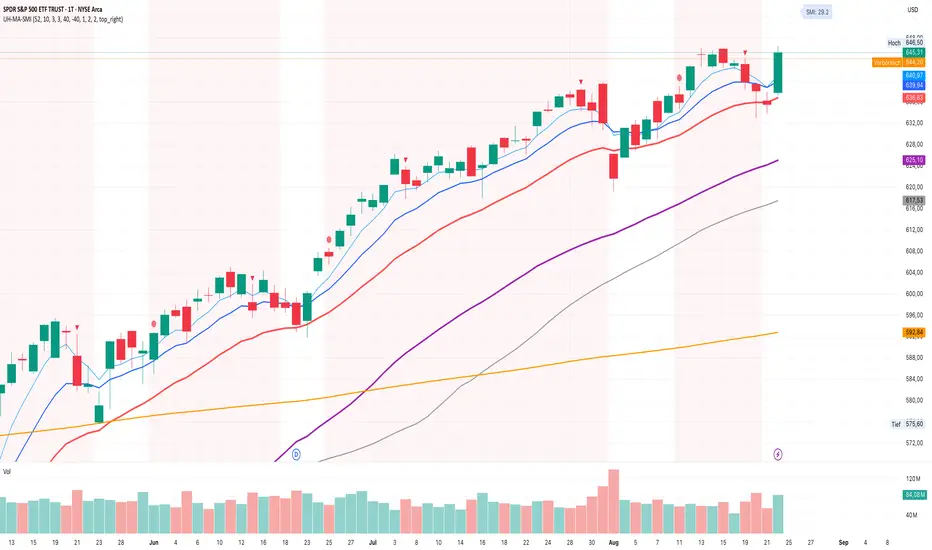
The UniqueHorn MA-SMI Indicator is a comprehensive trading tool that combines multiple Moving Averages with the Stochastic Momentum Index (SMI) in a clean, organized display. Designed for traders who need clear visual analysis of trend, momentum, and potential reversal points.
✨ Key Features
Moving Averages (8 Total)
3 EMAs: 5, 10, 20 (for quick trend detection)
5 SMAs: 30, 40, 50, 65, 200 (for medium to long-term trends)
Smart Timeframe Adaptation
Daily & Lower: EMA 5, 10, 20 | SMA 50, 65, 200
Weekly Chart: EMA 10, 20 | SMA 30, 40, 50, 200
Automatic display optimization based on timeframe
SMI Integration (Stochastic Momentum Index)
Visual signals directly on main chart
Overbought/Oversold markers
Bullish/Bearish crossover signals
Optional background coloring for extreme zones
Current SMI value as label
Climax Detection
Buying Climax: New 52-week high with red candle (weakness signal)
Selling Climax: New 52-week low with green candle (strength signal)
Works optimally on weekly charts
📈 Usage & Strategies
Trend Following
Use MAs as dynamic support/resistance
EMA crossovers for entry/exit signals
SMA 200 as primary trend filter
Momentum Trading
SMI < -40: Oversold zone → Potential long opportunity
SMI > 40: Overbought zone → Potential short opportunity
SMI crossovers as early trend reversal signals
Climax Trading
Buying Climax: Warning of potential top formation
Selling Climax: Indication of potential bottom formation
⚙️ Customization Options
Individual color selection for each MA
Separate line widths for EMA 5, 10, and other MAs
Show/Hide individual components
Fully adjustable SMI parameters
Optional info table with status overview
Comprehensive alert system for all signals
🎯 Ideal For
Swing Traders: Use the combination of MAs and SMI for optimal entries/exits
Position Traders: Focus on longer-term MAs and weekly chart signals
Day Traders: Fast EMAs with SMI momentum for short-term setups
📝 Notes
Climax signals work exclusively on weekly charts
SMI signals are available in all timeframes
Timeframe-specific MA display reduces visual clutter
Combine multiple signals for higher probability trades
🔔 Alert Functions
The indicator provides alerts for:
Buying/Selling Climaxes
SMI Overbought/Oversold zones
SMI Bullish/Bearish crossovers
EMA crossovers
Price-SMA200 crossovers
Version: 1.0
Pine Script: v6
Author: UniqueHorn
This indicator is the result of careful development and optimization for professional trading. For questions or suggestions, please use the comments section.
보호된 스크립트입니다
이 스크립트는 비공개 소스로 게시됩니다. 하지만 이를 자유롭게 제한 없이 사용할 수 있습니다 – 자세한 내용은 여기에서 확인하세요.
면책사항
해당 정보와 게시물은 금융, 투자, 트레이딩 또는 기타 유형의 조언이나 권장 사항으로 간주되지 않으며, 트레이딩뷰에서 제공하거나 보증하는 것이 아닙니다. 자세한 내용은 이용 약관을 참조하세요.
면책사항
해당 정보와 게시물은 금융, 투자, 트레이딩 또는 기타 유형의 조언이나 권장 사항으로 간주되지 않으며, 트레이딩뷰에서 제공하거나 보증하는 것이 아닙니다. 자세한 내용은 이용 약관을 참조하세요.