OPEN-SOURCE SCRIPT
업데이트됨 VPT and Heiken Ashi Candles MTF

The volume price trend indicator is used to determine the balance between a security’s demand and supply. The percentage change in the share price trend shows the relative supply or demand of a particular security, while volume indicates the force behind the trend. The VPT indicator is similar to the on-balance volume (OBV) indicator in that it measures cumulative volume and provides traders with information about a security’s money flow
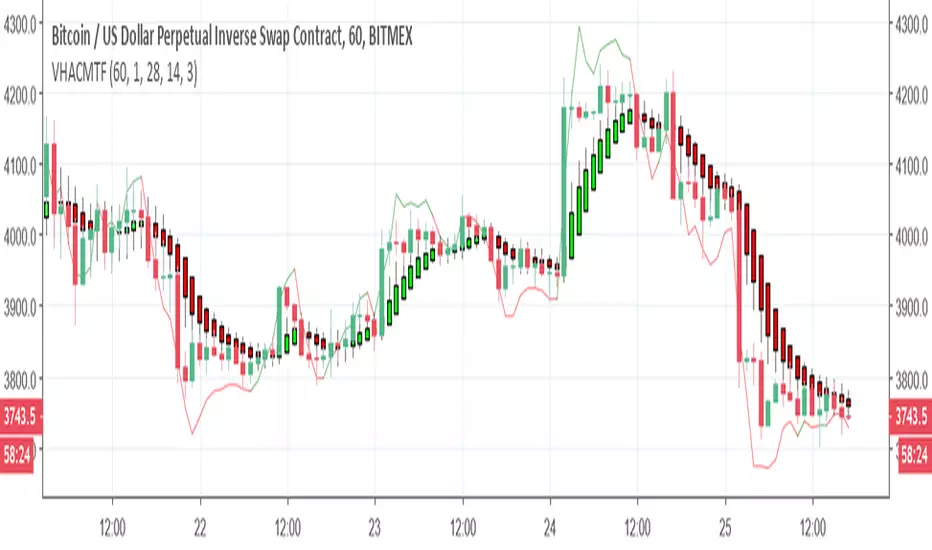
So we put the VPT and add HA candles with non repainting MTF , the crossing up or down of the VPT over candles create the signals
since VPT tend to overshoot you can smooth it with Leni..(just give the smoothing of the length this stupid name:) )
alerts inside

just example of play with MTF and the smooth of VPT
So we put the VPT and add HA candles with non repainting MTF , the crossing up or down of the VPT over candles create the signals
since VPT tend to overshoot you can smooth it with Leni..(just give the smoothing of the length this stupid name:) )
alerts inside
just example of play with MTF and the smooth of VPT
릴리즈 노트
I remove the signals as it probably repainting , the HA need to be converted to version 3 probably , sorry for this오픈 소스 스크립트
트레이딩뷰의 진정한 정신에 따라, 이 스크립트의 작성자는 이를 오픈소스로 공개하여 트레이더들이 기능을 검토하고 검증할 수 있도록 했습니다. 작성자에게 찬사를 보냅니다! 이 코드는 무료로 사용할 수 있지만, 코드를 재게시하는 경우 하우스 룰이 적용된다는 점을 기억하세요.
면책사항
해당 정보와 게시물은 금융, 투자, 트레이딩 또는 기타 유형의 조언이나 권장 사항으로 간주되지 않으며, 트레이딩뷰에서 제공하거나 보증하는 것이 아닙니다. 자세한 내용은 이용 약관을 참조하세요.
오픈 소스 스크립트
트레이딩뷰의 진정한 정신에 따라, 이 스크립트의 작성자는 이를 오픈소스로 공개하여 트레이더들이 기능을 검토하고 검증할 수 있도록 했습니다. 작성자에게 찬사를 보냅니다! 이 코드는 무료로 사용할 수 있지만, 코드를 재게시하는 경우 하우스 룰이 적용된다는 점을 기억하세요.
면책사항
해당 정보와 게시물은 금융, 투자, 트레이딩 또는 기타 유형의 조언이나 권장 사항으로 간주되지 않으며, 트레이딩뷰에서 제공하거나 보증하는 것이 아닙니다. 자세한 내용은 이용 약관을 참조하세요.