OPEN-SOURCE SCRIPT
Cycle VTLs – with Scaled Channels
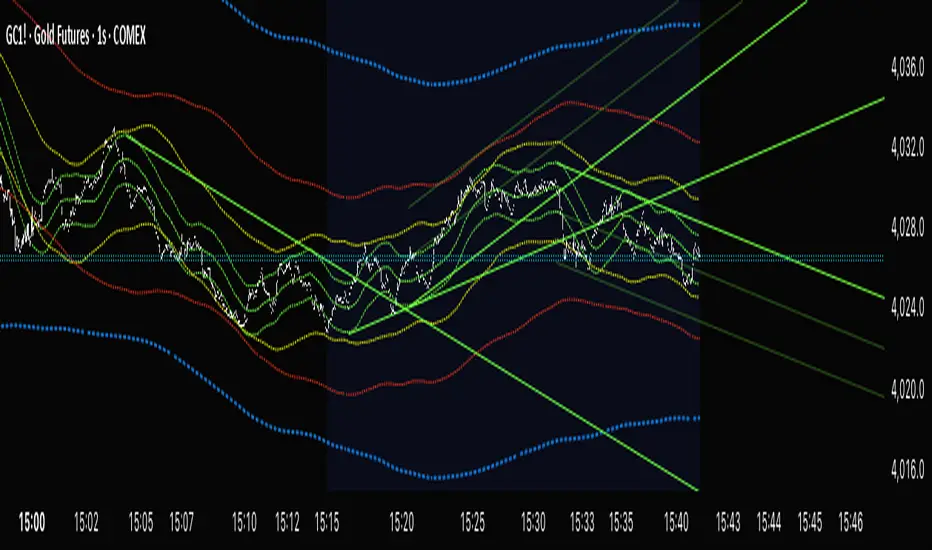
"Cycle VTLs – with Scaled Channels" for TradingView plots Valid Trend Lines (VTLs) based on Hurst's Cyclic Theory, connecting consecutive price peaks (downward VTLs) or troughs (upward VTLs) for specific cycles. It uses up to eight Simple Moving Averages (SMAs) (default lengths: 25, 50, 100, 200, 400, 800, 1600, 1600 bars) with customizable envelope bands to detect pivots and draw VTLs, enhanced by optional parallel channels scaled to envelope widths.
Key Features:
Valid Trend Lines (VTLs):
Upward VTLs: Connect consecutive cycle troughs, sloping upward.
Downward VTLs: Connect consecutive cycle peaks, sloping downward.
Hurst’s Rules:
Connects consecutive cycle peaks/troughs.
Must not cross price between points.
Downward VTLs:
No longer-cycle trough between peaks.
Invalid if slope is incorrect (upward VTL not up, downward VTL not down).
Expired VTLs: Historical VTLs (crossed by price) from up to three prior cycle waves.
SMA Cycles:
Eight customizable SMAs with envelope bands (offset × multiplier) for pivot detection.
Channels:
Optional parallel lines around VTLs, width set by channelFactor × envelope half-width.
Pivot Detection:
Fractal-based (pivotPeriod) on envelopes or price (usePriceFallback).
Customization:
Toggle cycles, VTLs, and channels.
Adjust SMA lengths, offsets, colors, line styles, and widths.
Enable centered envelopes, slope filtering, and limit stored lines (maxStoredLines).
Usage in Hurst’s Cyclic TheoryAnalysis:
VTLs identify cycle trends; upward VTLs suggest bullish momentum, downward VTLs bearish.
Price crossing below an upward VTL confirms a peak in the next longer cycle; crossing above a downward VTL confirms a trough.
Trading:
Buy: Price bounces off upward VTL or breaks above downward VTL.
Sell: Price rejects downward VTL or breaks below upward VTL.
Use channels for support/resistance, breakouts, or stop-loss/take-profit levels.
Workflow:
Add indicator on TradingView.
Enable desired cycles (e.g., 50-bar, 1600-bar), adjust pivotPeriod, channelFactor, and showOnlyCorrectSlope.
Monitor VTL crossings and channels for trade signals.
NotesOptimized for performance with line limits.
Ideal for cycle-based trend analysis across markets (stocks, forex, crypto).
Debug labels show pivot counts and VTL status.
This indicator supports Hurst’s Cyclic Theory for trend identification and trading decisions with flexible, cycle-based VTLs and channels.
Use global variable to scale to chart. best results use factors of 2 and double. try 2, 4, 8, 16...128, 256, etc until price action fits 95% in smallest cycle.
오픈 소스 스크립트
트레이딩뷰의 진정한 정신에 따라, 이 스크립트의 작성자는 이를 오픈소스로 공개하여 트레이더들이 기능을 검토하고 검증할 수 있도록 했습니다. 작성자에게 찬사를 보냅니다! 이 코드는 무료로 사용할 수 있지만, 코드를 재게시하는 경우 하우스 룰이 적용된다는 점을 기억하세요.
면책사항
해당 정보와 게시물은 금융, 투자, 트레이딩 또는 기타 유형의 조언이나 권장 사항으로 간주되지 않으며, 트레이딩뷰에서 제공하거나 보증하는 것이 아닙니다. 자세한 내용은 이용 약관을 참조하세요.
오픈 소스 스크립트
트레이딩뷰의 진정한 정신에 따라, 이 스크립트의 작성자는 이를 오픈소스로 공개하여 트레이더들이 기능을 검토하고 검증할 수 있도록 했습니다. 작성자에게 찬사를 보냅니다! 이 코드는 무료로 사용할 수 있지만, 코드를 재게시하는 경우 하우스 룰이 적용된다는 점을 기억하세요.
면책사항
해당 정보와 게시물은 금융, 투자, 트레이딩 또는 기타 유형의 조언이나 권장 사항으로 간주되지 않으며, 트레이딩뷰에서 제공하거나 보증하는 것이 아닙니다. 자세한 내용은 이용 약관을 참조하세요.