OPEN-SOURCE SCRIPT
Volume Reversals

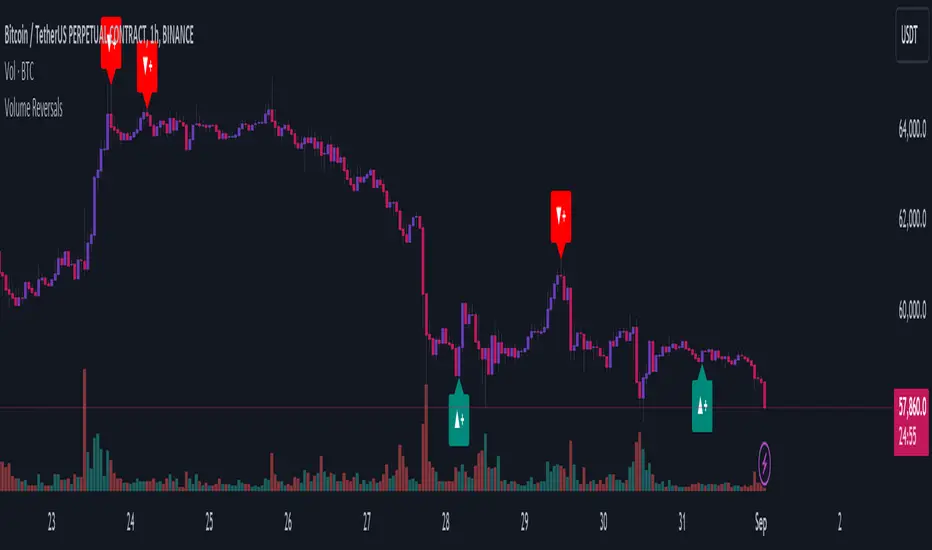
The "Volume Reversals" indicator is a trading tool designed to identify potential buy and sell signals based on volume patterns.
Features
Filter Signals : Traders can enable or disable additional filtering of signals, which refines the conditions under which buy and sell labels are displayed.
Buy and Sell Labels: The indicator dynamically places labels on the chart to signify buy ("▲+") and sell ("▼+") opportunities. Buy labels appear at low points of bars with a green upward-pointing arrow, while sell labels appear at high points with a red downward-pointing arrow.
Customizable Alerts: Users can set alerts for buy and sell signals, receiving notifications when conditions match predefined patterns.
Logic Explained
This indicator is suited for various assets and timeframes, especially in markets where volume plays a significant role in price dynamics.
Features
Filter Signals : Traders can enable or disable additional filtering of signals, which refines the conditions under which buy and sell labels are displayed.
Buy and Sell Labels: The indicator dynamically places labels on the chart to signify buy ("▲+") and sell ("▼+") opportunities. Buy labels appear at low points of bars with a green upward-pointing arrow, while sell labels appear at high points with a red downward-pointing arrow.
Customizable Alerts: Users can set alerts for buy and sell signals, receiving notifications when conditions match predefined patterns.
Logic Explained
- Volume Comparison: The script examines a sequence of the last five volume bars to detect increasing or decreasing trends.
- Price Action Analysis: Each volume bar is paired with a corresponding price action (bullish or bearish) from the same period.
- Signal Conditions: A signal is generated under two scenarios:
- Normal Conditions: Sequential increase/decrease in volume over three bars accompanied by bearish/bullish price action, followed by a dip in volume with a bullish/bearish bar.
- Filtered Conditions (if filter is active): Requires all last four bars to be bearish/bullish, the most recent bar's volume to be less than the immediate previous, and then exceeds the volume two bars prior, closing bullish/bearish.
This indicator is suited for various assets and timeframes, especially in markets where volume plays a significant role in price dynamics.
오픈 소스 스크립트
트레이딩뷰의 진정한 정신에 따라, 이 스크립트의 작성자는 이를 오픈소스로 공개하여 트레이더들이 기능을 검토하고 검증할 수 있도록 했습니다. 작성자에게 찬사를 보냅니다! 이 코드는 무료로 사용할 수 있지만, 코드를 재게시하는 경우 하우스 룰이 적용된다는 점을 기억하세요.
면책사항
해당 정보와 게시물은 금융, 투자, 트레이딩 또는 기타 유형의 조언이나 권장 사항으로 간주되지 않으며, 트레이딩뷰에서 제공하거나 보증하는 것이 아닙니다. 자세한 내용은 이용 약관을 참조하세요.
오픈 소스 스크립트
트레이딩뷰의 진정한 정신에 따라, 이 스크립트의 작성자는 이를 오픈소스로 공개하여 트레이더들이 기능을 검토하고 검증할 수 있도록 했습니다. 작성자에게 찬사를 보냅니다! 이 코드는 무료로 사용할 수 있지만, 코드를 재게시하는 경우 하우스 룰이 적용된다는 점을 기억하세요.
면책사항
해당 정보와 게시물은 금융, 투자, 트레이딩 또는 기타 유형의 조언이나 권장 사항으로 간주되지 않으며, 트레이딩뷰에서 제공하거나 보증하는 것이 아닙니다. 자세한 내용은 이용 약관을 참조하세요.