OPEN-SOURCE SCRIPT
Bollinger Bands %RSI
Hi All,
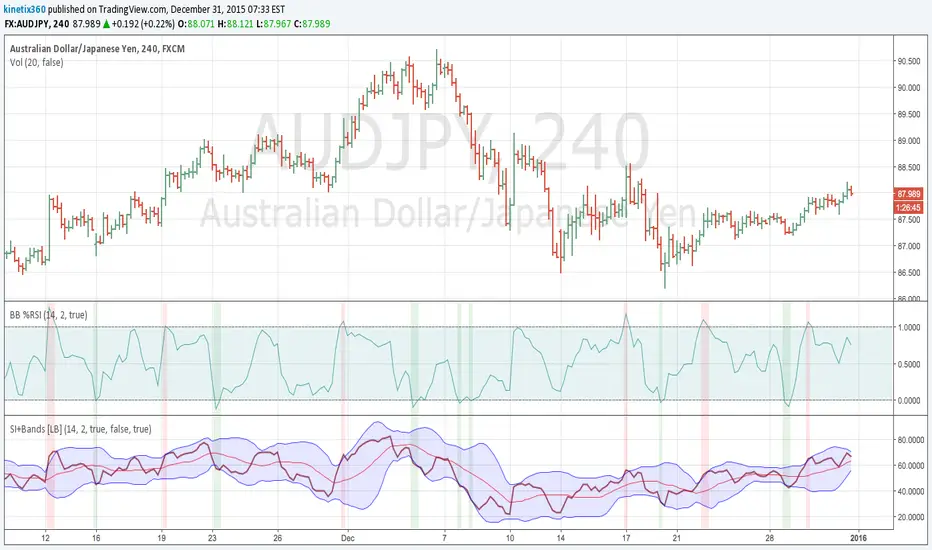
I am not a programmer, but I tried to buid BB% of RSI , base of John Bollinger' book. I cut and paste the function from LazyBear MFI/RSI BB indicator and original BB% scripts. Now, I need help for 2 things :
1. I already check by side with LazyBear indicator for the OB/OS, and all are good. One thing I don't understand is why we build the Basis for bb using "sma" ? any one can help me to understand with this?
2. I am happy with this, but I need to make the Source Price become customisable (close, hl/2, hlc/3, etc). and I don't know how to set it up. please help me with this.
Thank you.
오픈 소스 스크립트
트레이딩뷰의 진정한 정신에 따라, 이 스크립트의 작성자는 이를 오픈소스로 공개하여 트레이더들이 기능을 검토하고 검증할 수 있도록 했습니다. 작성자에게 찬사를 보냅니다! 이 코드는 무료로 사용할 수 있지만, 코드를 재게시하는 경우 하우스 룰이 적용된다는 점을 기억하세요.
면책사항
해당 정보와 게시물은 금융, 투자, 트레이딩 또는 기타 유형의 조언이나 권장 사항으로 간주되지 않으며, 트레이딩뷰에서 제공하거나 보증하는 것이 아닙니다. 자세한 내용은 이용 약관을 참조하세요.
오픈 소스 스크립트
트레이딩뷰의 진정한 정신에 따라, 이 스크립트의 작성자는 이를 오픈소스로 공개하여 트레이더들이 기능을 검토하고 검증할 수 있도록 했습니다. 작성자에게 찬사를 보냅니다! 이 코드는 무료로 사용할 수 있지만, 코드를 재게시하는 경우 하우스 룰이 적용된다는 점을 기억하세요.
면책사항
해당 정보와 게시물은 금융, 투자, 트레이딩 또는 기타 유형의 조언이나 권장 사항으로 간주되지 않으며, 트레이딩뷰에서 제공하거나 보증하는 것이 아닙니다. 자세한 내용은 이용 약관을 참조하세요.