OPEN-SOURCE SCRIPT
업데이트됨 Close Price Percentile
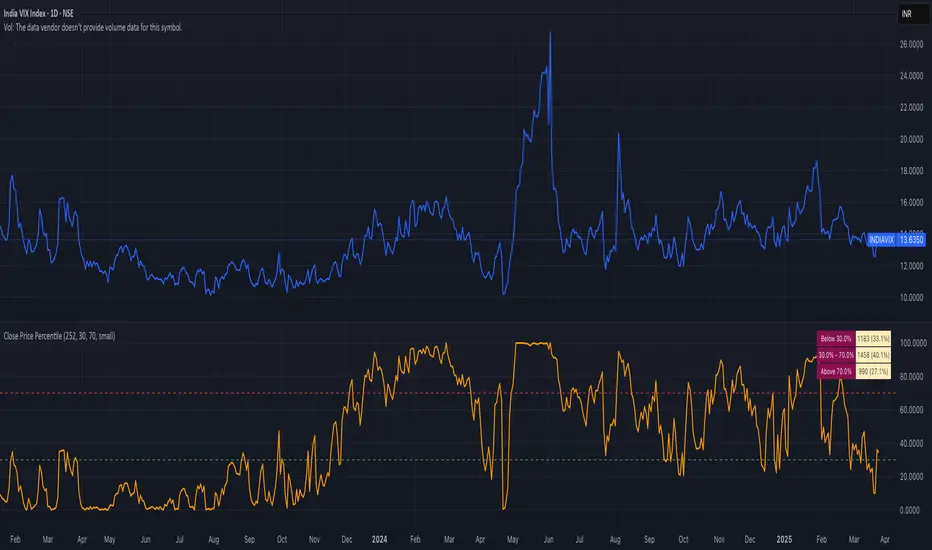
Close Price Percentile with Range Distribution
This indicator helps traders identify where the current price stands relative to its historical context using percentile ranking. It calculates and displays the current price's percentile position within a customizable lookback window (default: 365 periods).
Key Features:
• Percentile Ranking: Shows where the current price falls within its historical range (0-100%)
• Customizable Thresholds: Set your own high/low percentile boundaries for analysis
• Statistical Distribution: Tracks and displays the number and percentage of data points falling in each range (below threshold, between thresholds, above threshold)
• Visual References: Includes dashed lines at threshold levels for easy visual reference
• Clean Data Presentation: Organized table display in the top-right corner
Perfect for:
• Understanding price extremes
• Identifying potential overbought/oversold conditions
• Statistical analysis of price movements
• Mean reversion strategies
Fully customizable with adjustable window length, thresholds, and visual settings.
릴리즈 노트
Close Price Percentile with Range DistributionThis indicator helps traders identify where the current price stands relative to its historical context using percentile ranking. It calculates and displays the current price's percentile position within a customizable lookback window (default: 365 periods).
Key Features:
• Percentile Ranking: Shows where the current price falls within its historical range (0-100%)
• Customizable Thresholds: Set your own high/low percentile boundaries for analysis
• Statistical Distribution: Tracks and displays the number and percentage of data points falling in each range (below threshold, between thresholds, above threshold)
• Visual References: Includes dashed lines at threshold levels for easy visual reference
• Clean Data Presentation: Organized table display in the top-right corner
Perfect for:
• Understanding price extremes
• Identifying potential overbought/oversold conditions
• Statistical analysis of price movements
• Mean reversion strategies
Fully customizable with adjustable window length, thresholds, and visual settings.
오픈 소스 스크립트
트레이딩뷰의 진정한 정신에 따라, 이 스크립트의 작성자는 이를 오픈소스로 공개하여 트레이더들이 기능을 검토하고 검증할 수 있도록 했습니다. 작성자에게 찬사를 보냅니다! 이 코드는 무료로 사용할 수 있지만, 코드를 재게시하는 경우 하우스 룰이 적용된다는 점을 기억하세요.
면책사항
해당 정보와 게시물은 금융, 투자, 트레이딩 또는 기타 유형의 조언이나 권장 사항으로 간주되지 않으며, 트레이딩뷰에서 제공하거나 보증하는 것이 아닙니다. 자세한 내용은 이용 약관을 참조하세요.
오픈 소스 스크립트
트레이딩뷰의 진정한 정신에 따라, 이 스크립트의 작성자는 이를 오픈소스로 공개하여 트레이더들이 기능을 검토하고 검증할 수 있도록 했습니다. 작성자에게 찬사를 보냅니다! 이 코드는 무료로 사용할 수 있지만, 코드를 재게시하는 경우 하우스 룰이 적용된다는 점을 기억하세요.
면책사항
해당 정보와 게시물은 금융, 투자, 트레이딩 또는 기타 유형의 조언이나 권장 사항으로 간주되지 않으며, 트레이딩뷰에서 제공하거나 보증하는 것이 아닙니다. 자세한 내용은 이용 약관을 참조하세요.