OPEN-SOURCE SCRIPT
업데이트됨 Fast WMA
The Fast WMA is a reactive trend-following tool designed to provide rapid signals on the ETHBTC ratio. It uses advanced smoothing techniques and normalized thresholds to detect trends effectively. Let’s break it down further:
Source Smoothing with Standard Deviations
The source price data is smoothed by calculating its standard deviation, which measures how far prices typically move from the average. This creates upper and lower deviation levels:
The upper deviation represents a high boundary where prices might be overextended.
The lower deviation represents a low boundary where prices might be oversold.
These deviations are combined with the Weighted Moving Average (WMA) to filter out noise and focus on significant price movements.
Weighting the WMA for Further Smoothing
The Weighted Moving Average (WMA) itself is refined by applying adjustable weights:
An upper weight expands the WMA, forming an Upper Band.
A lower weight compresses the WMA, forming a Lower Band.
This dual-weighted approach allows the tool to adapt dynamically to price action, highlighting areas of potential trend reversals or continuations.
Normalized WMA (NWMA) with Adjustable Thresholds
The Normalized WMA (NWMA) adds an extra layer of analysis:
It compares the source price to its smoothed average, expressing the result as a percentage change.
This helps identify whether the market is overbought (positive NWMA) or oversold (negative NWMA).
Two adjustable thresholds—a long threshold (for buy signals) and a short threshold (for sell signals)—allow users to fine-tune the sensitivity of these signals based on their trading style or the market's volatility.
Entry/Exit Conditions
The Fast WMA generates signals based on two conditions:
Buy (Long) Signal:
Occurs when the price stays above the lower deviation level, and the NWMA crosses above the long threshold.
Indicates bullish momentum and suggests an upward trend.
Sell (Short) Signal:
Occurs when the price falls below the upper deviation level, and the NWMA drops below the short threshold.
Indicates bearish momentum and suggests a downward trend.
Important Note
This indicator is not designed to work alone. It’s a powerful tool for identifying trends but should be combined with other analyses, such as volume, higher time-frame trends, or fundamental analysis, for better decision-making.
Plotting Features
The Fast WMA includes intuitive visual cues to enhance usability:
Color-Coded Signals:
Colors change dynamically to indicate trend direction.
Options are available to customize the color scheme (e.g., for specific trading pairs like ETHBTC or SOLBTC).
Threshold Lines:
Dashed horizontal lines mark the long and short thresholds, helping users visualize signal levels.
Bands and Fill Areas:
The Upper Band and Lower Band are plotted around the WMA, with shaded regions indicating the deviation zones.
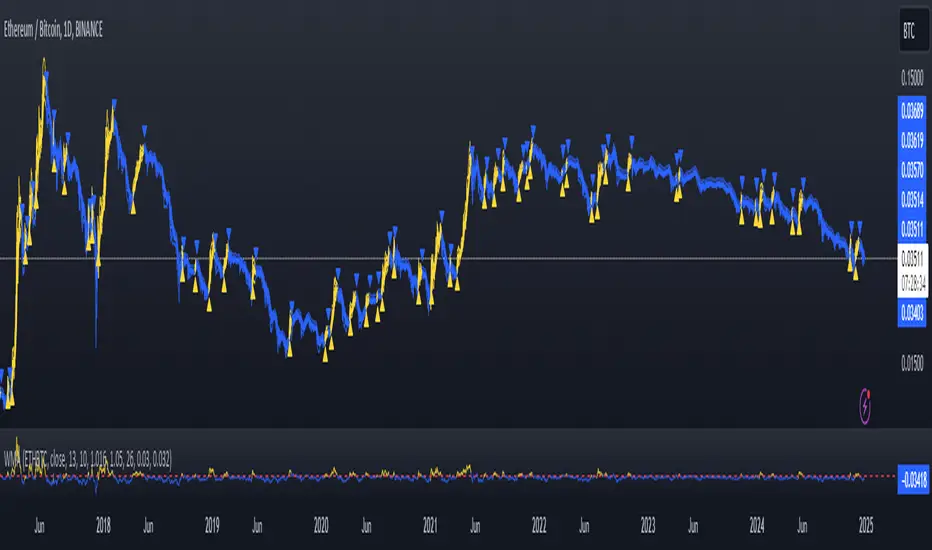
Signal Arrows:
Triangles appear below or above candles to highlight potential buy (upward arrow) or sell (downward arrow) points.
Bar Coloring:
Candlesticks are colored according to trend direction, making it easier to identify trends at a glance.
The Fast WMA combines mathematical precision with user-friendly visualization, offering traders a versatile tool to analyze trends and make informed decisions. However, like any indicator, it’s most effective when used as part of a broader trading strategy.
Source Smoothing with Standard Deviations
The source price data is smoothed by calculating its standard deviation, which measures how far prices typically move from the average. This creates upper and lower deviation levels:
The upper deviation represents a high boundary where prices might be overextended.
The lower deviation represents a low boundary where prices might be oversold.
These deviations are combined with the Weighted Moving Average (WMA) to filter out noise and focus on significant price movements.
Weighting the WMA for Further Smoothing
The Weighted Moving Average (WMA) itself is refined by applying adjustable weights:
An upper weight expands the WMA, forming an Upper Band.
A lower weight compresses the WMA, forming a Lower Band.
This dual-weighted approach allows the tool to adapt dynamically to price action, highlighting areas of potential trend reversals or continuations.
Normalized WMA (NWMA) with Adjustable Thresholds
The Normalized WMA (NWMA) adds an extra layer of analysis:
It compares the source price to its smoothed average, expressing the result as a percentage change.
This helps identify whether the market is overbought (positive NWMA) or oversold (negative NWMA).
Two adjustable thresholds—a long threshold (for buy signals) and a short threshold (for sell signals)—allow users to fine-tune the sensitivity of these signals based on their trading style or the market's volatility.
Entry/Exit Conditions
The Fast WMA generates signals based on two conditions:
Buy (Long) Signal:
Occurs when the price stays above the lower deviation level, and the NWMA crosses above the long threshold.
Indicates bullish momentum and suggests an upward trend.
Sell (Short) Signal:
Occurs when the price falls below the upper deviation level, and the NWMA drops below the short threshold.
Indicates bearish momentum and suggests a downward trend.
Important Note
This indicator is not designed to work alone. It’s a powerful tool for identifying trends but should be combined with other analyses, such as volume, higher time-frame trends, or fundamental analysis, for better decision-making.
Plotting Features
The Fast WMA includes intuitive visual cues to enhance usability:
Color-Coded Signals:
Colors change dynamically to indicate trend direction.
Options are available to customize the color scheme (e.g., for specific trading pairs like ETHBTC or SOLBTC).
Threshold Lines:
Dashed horizontal lines mark the long and short thresholds, helping users visualize signal levels.
Bands and Fill Areas:
The Upper Band and Lower Band are plotted around the WMA, with shaded regions indicating the deviation zones.
Signal Arrows:
Triangles appear below or above candles to highlight potential buy (upward arrow) or sell (downward arrow) points.
Bar Coloring:
Candlesticks are colored according to trend direction, making it easier to identify trends at a glance.
The Fast WMA combines mathematical precision with user-friendly visualization, offering traders a versatile tool to analyze trends and make informed decisions. However, like any indicator, it’s most effective when used as part of a broader trading strategy.
릴리즈 노트
z오픈 소스 스크립트
트레이딩뷰의 진정한 정신에 따라, 이 스크립트의 작성자는 이를 오픈소스로 공개하여 트레이더들이 기능을 검토하고 검증할 수 있도록 했습니다. 작성자에게 찬사를 보냅니다! 이 코드는 무료로 사용할 수 있지만, 코드를 재게시하는 경우 하우스 룰이 적용된다는 점을 기억하세요.
면책사항
해당 정보와 게시물은 금융, 투자, 트레이딩 또는 기타 유형의 조언이나 권장 사항으로 간주되지 않으며, 트레이딩뷰에서 제공하거나 보증하는 것이 아닙니다. 자세한 내용은 이용 약관을 참조하세요.
오픈 소스 스크립트
트레이딩뷰의 진정한 정신에 따라, 이 스크립트의 작성자는 이를 오픈소스로 공개하여 트레이더들이 기능을 검토하고 검증할 수 있도록 했습니다. 작성자에게 찬사를 보냅니다! 이 코드는 무료로 사용할 수 있지만, 코드를 재게시하는 경우 하우스 룰이 적용된다는 점을 기억하세요.
면책사항
해당 정보와 게시물은 금융, 투자, 트레이딩 또는 기타 유형의 조언이나 권장 사항으로 간주되지 않으며, 트레이딩뷰에서 제공하거나 보증하는 것이 아닙니다. 자세한 내용은 이용 약관을 참조하세요.