OPEN-SOURCE SCRIPT
Squeeze PRO Indicator [Makit0]
SQUEEZE PRO INDICATOR [Makit0] v0.5Beta
Script based in:
original John Carter's ideas (SQUEEZE & SQUEEZE PRO) at simplertrading dot com
LazyBear's script (Squeeze Momentum Indicator) here at tradingview dot com
USE IT IN CONJUNCTION WITH THE SQUEEZE PRO ARROWS INDICATOR
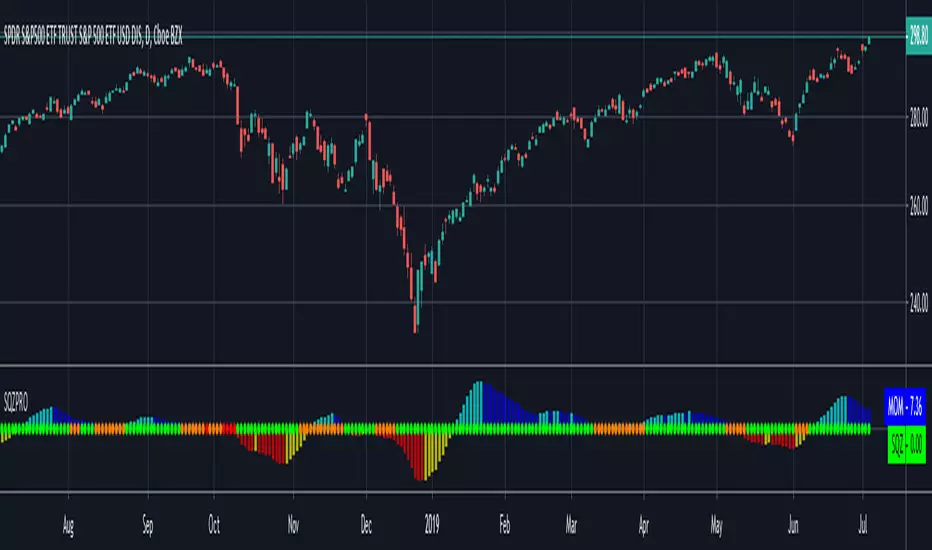
This system is based in the volatility reversion to the mean: volatility contraction leads to volatility expansion and the other way on
The dot signal is a warning of volatility compression, more often than not this leads to a expansion of volatility and a move in the action price usually bigger than the expected move
Be aware of the trend direction, use the momentum histogram to see the slope direction
There are 3 levels of compression:
Level 1: ORANGE, the lesser compresion level
Level 2: RED, the normal level marked by the original squeeze indicator
Level 3: YELLOW, the max compression level
The more the compression the bigger the after move
The GREEN dots signal the volatility expansion out of the squeeze ranges
Please check the John Carter's book (Mastering the Trade) and attend his webinars for more insight about the squeeze & squeeze pro systems
I'm starting at trading and learning every day, I attended one of his webinars about the Squeeze Pro, and with help of the LazyBear's Squeeze Momentum Indicator code up the Squeeze PRO.
Please be aware, I'm not an expert trader, only a developer with an idea: learn to pull out money from the market in a consistent way.
This is a Beta version, please feel free to comment and give feedback, anything you consider iteresting, the more you elaborate the better :D
Thanks you all!!!
Script based in:
original John Carter's ideas (SQUEEZE & SQUEEZE PRO) at simplertrading dot com
LazyBear's script (Squeeze Momentum Indicator) here at tradingview dot com
USE IT IN CONJUNCTION WITH THE SQUEEZE PRO ARROWS INDICATOR
This system is based in the volatility reversion to the mean: volatility contraction leads to volatility expansion and the other way on
The dot signal is a warning of volatility compression, more often than not this leads to a expansion of volatility and a move in the action price usually bigger than the expected move
Be aware of the trend direction, use the momentum histogram to see the slope direction
There are 3 levels of compression:
Level 1: ORANGE, the lesser compresion level
Level 2: RED, the normal level marked by the original squeeze indicator
Level 3: YELLOW, the max compression level
The more the compression the bigger the after move
The GREEN dots signal the volatility expansion out of the squeeze ranges
Please check the John Carter's book (Mastering the Trade) and attend his webinars for more insight about the squeeze & squeeze pro systems
I'm starting at trading and learning every day, I attended one of his webinars about the Squeeze Pro, and with help of the LazyBear's Squeeze Momentum Indicator code up the Squeeze PRO.
Please be aware, I'm not an expert trader, only a developer with an idea: learn to pull out money from the market in a consistent way.
This is a Beta version, please feel free to comment and give feedback, anything you consider iteresting, the more you elaborate the better :D
Thanks you all!!!
오픈 소스 스크립트
트레이딩뷰의 진정한 정신에 따라, 이 스크립트의 작성자는 이를 오픈소스로 공개하여 트레이더들이 기능을 검토하고 검증할 수 있도록 했습니다. 작성자에게 찬사를 보냅니다! 이 코드는 무료로 사용할 수 있지만, 코드를 재게시하는 경우 하우스 룰이 적용된다는 점을 기억하세요.
면책사항
해당 정보와 게시물은 금융, 투자, 트레이딩 또는 기타 유형의 조언이나 권장 사항으로 간주되지 않으며, 트레이딩뷰에서 제공하거나 보증하는 것이 아닙니다. 자세한 내용은 이용 약관을 참조하세요.
오픈 소스 스크립트
트레이딩뷰의 진정한 정신에 따라, 이 스크립트의 작성자는 이를 오픈소스로 공개하여 트레이더들이 기능을 검토하고 검증할 수 있도록 했습니다. 작성자에게 찬사를 보냅니다! 이 코드는 무료로 사용할 수 있지만, 코드를 재게시하는 경우 하우스 룰이 적용된다는 점을 기억하세요.
면책사항
해당 정보와 게시물은 금융, 투자, 트레이딩 또는 기타 유형의 조언이나 권장 사항으로 간주되지 않으며, 트레이딩뷰에서 제공하거나 보증하는 것이 아닙니다. 자세한 내용은 이용 약관을 참조하세요.