OPEN-SOURCE SCRIPT
업데이트됨 RISK
## Main Purpose
The indicator calculates and displays risk levels based on margin requirements and daily settlement prices, helping traders visualize their potential risk exposure.
## Key Features
**Inputs:**
- **Margin for Calculation**: The CME long margin requirement for the asset
- **HTF Margin Line**: An anchor point for higher timeframe margin calculations
**Core Calculations:**
1. **Settlement Price Tracking**: Captures daily settlement prices during specific session times (6:58-6:59 PM ET for close, 6:00-6:01 PM ET for new day open)
2. **Risk Percentage**: Calculates `margin / (point value × settlement price)` - with special handling for Micro contracts (symbols starting with "M") that uses 10× point value
3. **Risk Intervals**: Determines price intervals representing one margin unit of risk
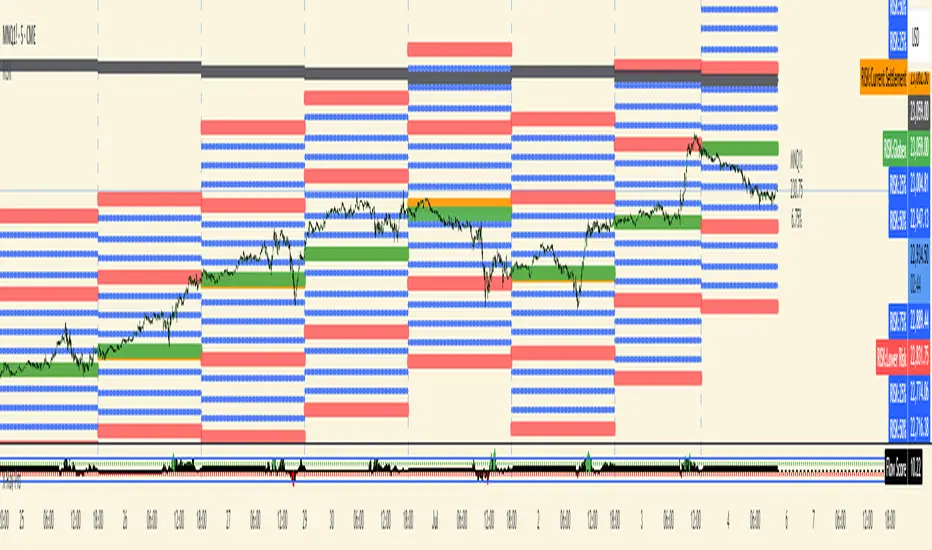
## Visual Display
The indicator plots multiple risk levels on the chart:
- **Settlement price** (orange circles)
- **Globex open** (green circles)
- **Upper/Lower Risk levels** (red circles) - one and two risk intervals away
- **Subdivision levels** (blue crosses) - 25%, 50%, and 75% of each risk interval
- **MHP+ level** (black crosses) - HTF anchor adjusted by risk percentage
- **HTF Anchor** (black crosses)
## Practical Use
This helps futures traders:
- Visualize how far price can move before hitting margin calls
- See risk levels relative to daily settlements
- Plan position sizing and risk management
- Understand exposure in terms of actual margin requirements
The indicator essentially transforms abstract margin numbers into concrete price levels on the chart, making risk management more visual and intuitive.
The indicator calculates and displays risk levels based on margin requirements and daily settlement prices, helping traders visualize their potential risk exposure.
## Key Features
**Inputs:**
- **Margin for Calculation**: The CME long margin requirement for the asset
- **HTF Margin Line**: An anchor point for higher timeframe margin calculations
**Core Calculations:**
1. **Settlement Price Tracking**: Captures daily settlement prices during specific session times (6:58-6:59 PM ET for close, 6:00-6:01 PM ET for new day open)
2. **Risk Percentage**: Calculates `margin / (point value × settlement price)` - with special handling for Micro contracts (symbols starting with "M") that uses 10× point value
3. **Risk Intervals**: Determines price intervals representing one margin unit of risk
## Visual Display
The indicator plots multiple risk levels on the chart:
- **Settlement price** (orange circles)
- **Globex open** (green circles)
- **Upper/Lower Risk levels** (red circles) - one and two risk intervals away
- **Subdivision levels** (blue crosses) - 25%, 50%, and 75% of each risk interval
- **MHP+ level** (black crosses) - HTF anchor adjusted by risk percentage
- **HTF Anchor** (black crosses)
## Practical Use
This helps futures traders:
- Visualize how far price can move before hitting margin calls
- See risk levels relative to daily settlements
- Plan position sizing and risk management
- Understand exposure in terms of actual margin requirements
The indicator essentially transforms abstract margin numbers into concrete price levels on the chart, making risk management more visual and intuitive.
릴리즈 노트
Updated to show settlement correctly regardless of chart settings오픈 소스 스크립트
트레이딩뷰의 진정한 정신에 따라, 이 스크립트의 작성자는 이를 오픈소스로 공개하여 트레이더들이 기능을 검토하고 검증할 수 있도록 했습니다. 작성자에게 찬사를 보냅니다! 이 코드는 무료로 사용할 수 있지만, 코드를 재게시하는 경우 하우스 룰이 적용된다는 점을 기억하세요.
면책사항
해당 정보와 게시물은 금융, 투자, 트레이딩 또는 기타 유형의 조언이나 권장 사항으로 간주되지 않으며, 트레이딩뷰에서 제공하거나 보증하는 것이 아닙니다. 자세한 내용은 이용 약관을 참조하세요.
오픈 소스 스크립트
트레이딩뷰의 진정한 정신에 따라, 이 스크립트의 작성자는 이를 오픈소스로 공개하여 트레이더들이 기능을 검토하고 검증할 수 있도록 했습니다. 작성자에게 찬사를 보냅니다! 이 코드는 무료로 사용할 수 있지만, 코드를 재게시하는 경우 하우스 룰이 적용된다는 점을 기억하세요.
면책사항
해당 정보와 게시물은 금융, 투자, 트레이딩 또는 기타 유형의 조언이나 권장 사항으로 간주되지 않으며, 트레이딩뷰에서 제공하거나 보증하는 것이 아닙니다. 자세한 내용은 이용 약관을 참조하세요.