OPEN-SOURCE SCRIPT
Wick/Tail Candle Measurements
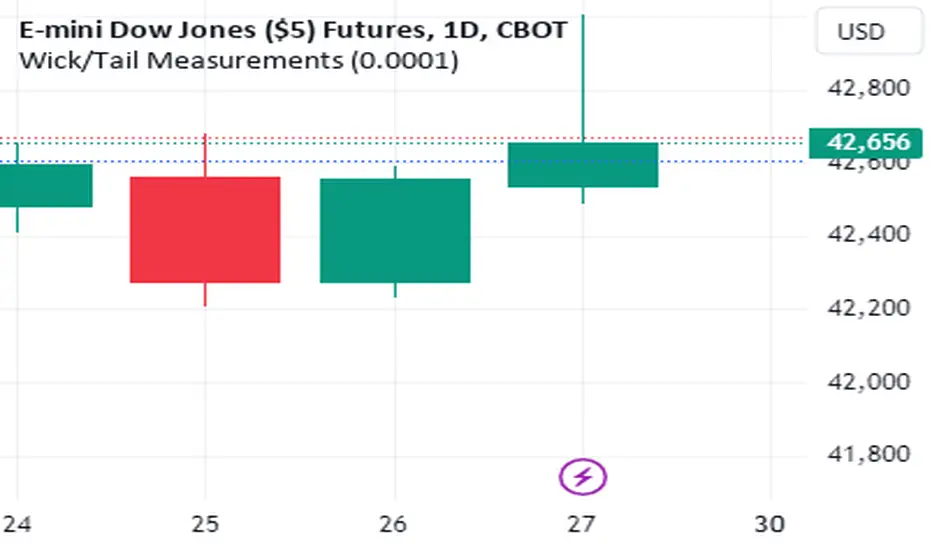
This indicator runs on trading view. It was programmed with pine script v5.
Once the indicator is running you can scroll your chart to any year or date on the chart, then for the input select the date your interested in knowing the length of the tails and wicks from a bar and their lengths are measured in points.
To move the measurement, you can select the vertical bar built into the indicator AFTER clicking the green label and moving it around using the vertical bar *only*. You must click the vertical bar in the middle of the label to move the indicator calculation to another bar. You can also just select the date using the input as mentioned. This indicator calculates just one bar at a time.
measurements are from bar OPEN to bar HIGH for measured WICKS regardless of the bar being long or short and from bar OPEN to bar LOW for measured TAILS also regardless of the bar being long or short.
This indicator calculates tails and wicks including the bar body in the calculations. Basically showing you how much the market moved in a certain direction for the entire duration of that Doji candle.
Its designed to measure completed bars on the daily futures charts. (Dow Jones, ES&P500, Nasdaq, Russell 2000, etc) Although it may work well on other markets. The indicator could easily be tweaked in order to work well with other markets. It is not designed for forex markets currently.
오픈 소스 스크립트
트레이딩뷰의 진정한 정신에 따라, 이 스크립트의 작성자는 이를 오픈소스로 공개하여 트레이더들이 기능을 검토하고 검증할 수 있도록 했습니다. 작성자에게 찬사를 보냅니다! 이 코드는 무료로 사용할 수 있지만, 코드를 재게시하는 경우 하우스 룰이 적용된다는 점을 기억하세요.
면책사항
해당 정보와 게시물은 금융, 투자, 트레이딩 또는 기타 유형의 조언이나 권장 사항으로 간주되지 않으며, 트레이딩뷰에서 제공하거나 보증하는 것이 아닙니다. 자세한 내용은 이용 약관을 참조하세요.
오픈 소스 스크립트
트레이딩뷰의 진정한 정신에 따라, 이 스크립트의 작성자는 이를 오픈소스로 공개하여 트레이더들이 기능을 검토하고 검증할 수 있도록 했습니다. 작성자에게 찬사를 보냅니다! 이 코드는 무료로 사용할 수 있지만, 코드를 재게시하는 경우 하우스 룰이 적용된다는 점을 기억하세요.
면책사항
해당 정보와 게시물은 금융, 투자, 트레이딩 또는 기타 유형의 조언이나 권장 사항으로 간주되지 않으며, 트레이딩뷰에서 제공하거나 보증하는 것이 아닙니다. 자세한 내용은 이용 약관을 참조하세요.