OPEN-SOURCE SCRIPT
업데이트됨 Donchian Channels with Strategy
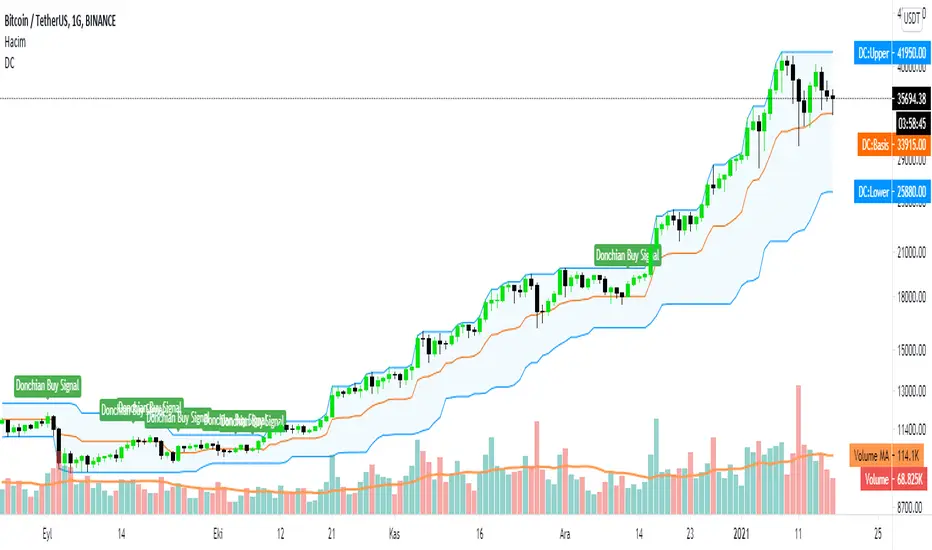
Donchian Channels are three lines generated by moving average calculations that comprise an indicator formed by upper and lower bands around a mid-range or median band. The upper band marks the highest price of a security over N periods while the lower band marks the lowest price of a security over N periods. The area between the upper and lower bands represents the Donchian Channel. Career futures trader Richard Donchian developed the indicator in the mid-twentieth century to help him identify trends. He would later be nicknamed "The Father of Trend Following."
How To Calculate Donchian Channels
Channel High:
Choose time period (N minutes/hours/days/weeks/months).
Compare the high print for each minute, hour, day, week or month over that period.
Choose the highest print.
Plot the result.
Channel Low:
Choose time period (N minutes/hours/days/weeks/months).
Compare the low print for each minute, hour, day, week or month over that period.
Choose the lowest print.
Plot the result.
Center Channel:
Choose time period (N minutes/hours/days/weeks/months).
Compare high and low prints for each minute, hour, day, week or month over that period.
Subtract the highest high print from lowest low print and divide by 2.
Plot the result.
This scripts gives you to alerts
If price above the center channel this means BUY and script tells you are at the BUY ZONE
릴리즈 노트
In this version we changed some tickets name and made some bug fixes.오픈 소스 스크립트
트레이딩뷰의 진정한 정신에 따라, 이 스크립트의 작성자는 이를 오픈소스로 공개하여 트레이더들이 기능을 검토하고 검증할 수 있도록 했습니다. 작성자에게 찬사를 보냅니다! 이 코드는 무료로 사용할 수 있지만, 코드를 재게시하는 경우 하우스 룰이 적용된다는 점을 기억하세요.
면책사항
해당 정보와 게시물은 금융, 투자, 트레이딩 또는 기타 유형의 조언이나 권장 사항으로 간주되지 않으며, 트레이딩뷰에서 제공하거나 보증하는 것이 아닙니다. 자세한 내용은 이용 약관을 참조하세요.
오픈 소스 스크립트
트레이딩뷰의 진정한 정신에 따라, 이 스크립트의 작성자는 이를 오픈소스로 공개하여 트레이더들이 기능을 검토하고 검증할 수 있도록 했습니다. 작성자에게 찬사를 보냅니다! 이 코드는 무료로 사용할 수 있지만, 코드를 재게시하는 경우 하우스 룰이 적용된다는 점을 기억하세요.
면책사항
해당 정보와 게시물은 금융, 투자, 트레이딩 또는 기타 유형의 조언이나 권장 사항으로 간주되지 않으며, 트레이딩뷰에서 제공하거나 보증하는 것이 아닙니다. 자세한 내용은 이용 약관을 참조하세요.