OPEN-SOURCE SCRIPT
Serajian Oscillator
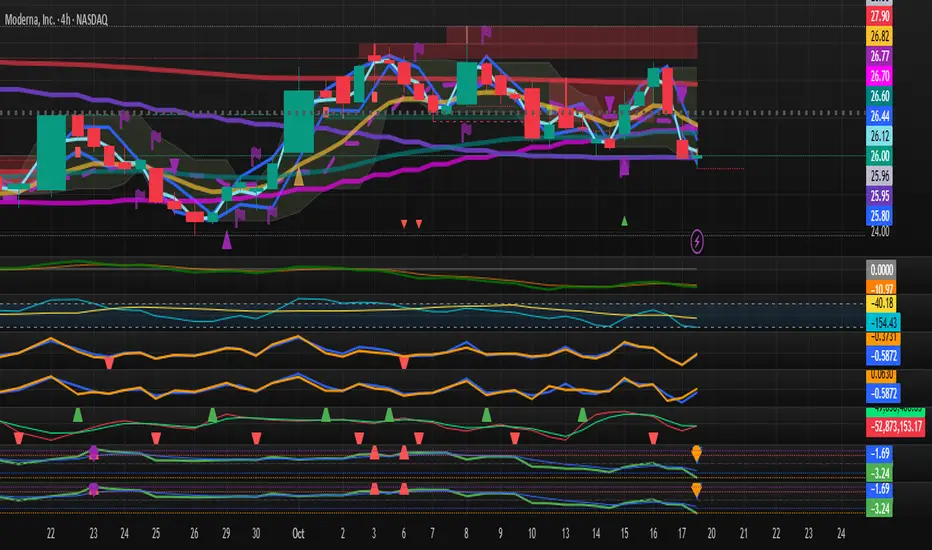
Unleash the power of momentum with the Serajian Oscillator! This innovative indicator tracks the normalized difference between price and volume Rate of Change (ROC), delivering a vibrant oscillator with a 5-period EMA for visual guidance. Spot high-probability reversals with striking markers at the chart’s bottom: red triangles signal overbought conditions (> +2.0), blue triangles highlight oversold zones (< -2.0), purple diamonds flag extreme overbought levels (> +3.0), and orange diamonds pinpoint extreme oversold opportunities (< -3.0). Stay ahead with instant alerts on zone entries! Perfect for traders hunting reversals in stocks, forex, or crypto, the Serajian Oscillator lets you fine-tune ROC Period, Normalization Period, and zone thresholds to match your strategy.
**Important**: Like all indicators, the Serajian Oscillator can generate false signals and should not be used alone. Always combine it with other technical analysis tools, price action, or market context for confirmation. This indicator is provided for informational purposes only. Traders are solely responsible for thoroughly backtesting and validating its performance before use. The author is not responsible for any financial losses or decisions made based on this indicator. Use at your own risk and dive into the action wisely!
**Important**: Like all indicators, the Serajian Oscillator can generate false signals and should not be used alone. Always combine it with other technical analysis tools, price action, or market context for confirmation. This indicator is provided for informational purposes only. Traders are solely responsible for thoroughly backtesting and validating its performance before use. The author is not responsible for any financial losses or decisions made based on this indicator. Use at your own risk and dive into the action wisely!
오픈 소스 스크립트
진정한 트레이딩뷰 정신에 따라 이 스크립트 작성자는 트레이더가 기능을 검토하고 검증할 수 있도록 오픈소스로 공개했습니다. 작성자에게 찬사를 보냅니다! 무료로 사용할 수 있지만 코드를 다시 게시할 경우 하우스 룰이 적용된다는 점을 기억하세요.
면책사항
이 정보와 게시물은 TradingView에서 제공하거나 보증하는 금융, 투자, 거래 또는 기타 유형의 조언이나 권고 사항을 의미하거나 구성하지 않습니다. 자세한 내용은 이용 약관을 참고하세요.
오픈 소스 스크립트
진정한 트레이딩뷰 정신에 따라 이 스크립트 작성자는 트레이더가 기능을 검토하고 검증할 수 있도록 오픈소스로 공개했습니다. 작성자에게 찬사를 보냅니다! 무료로 사용할 수 있지만 코드를 다시 게시할 경우 하우스 룰이 적용된다는 점을 기억하세요.
면책사항
이 정보와 게시물은 TradingView에서 제공하거나 보증하는 금융, 투자, 거래 또는 기타 유형의 조언이나 권고 사항을 의미하거나 구성하지 않습니다. 자세한 내용은 이용 약관을 참고하세요.